Fig. 6
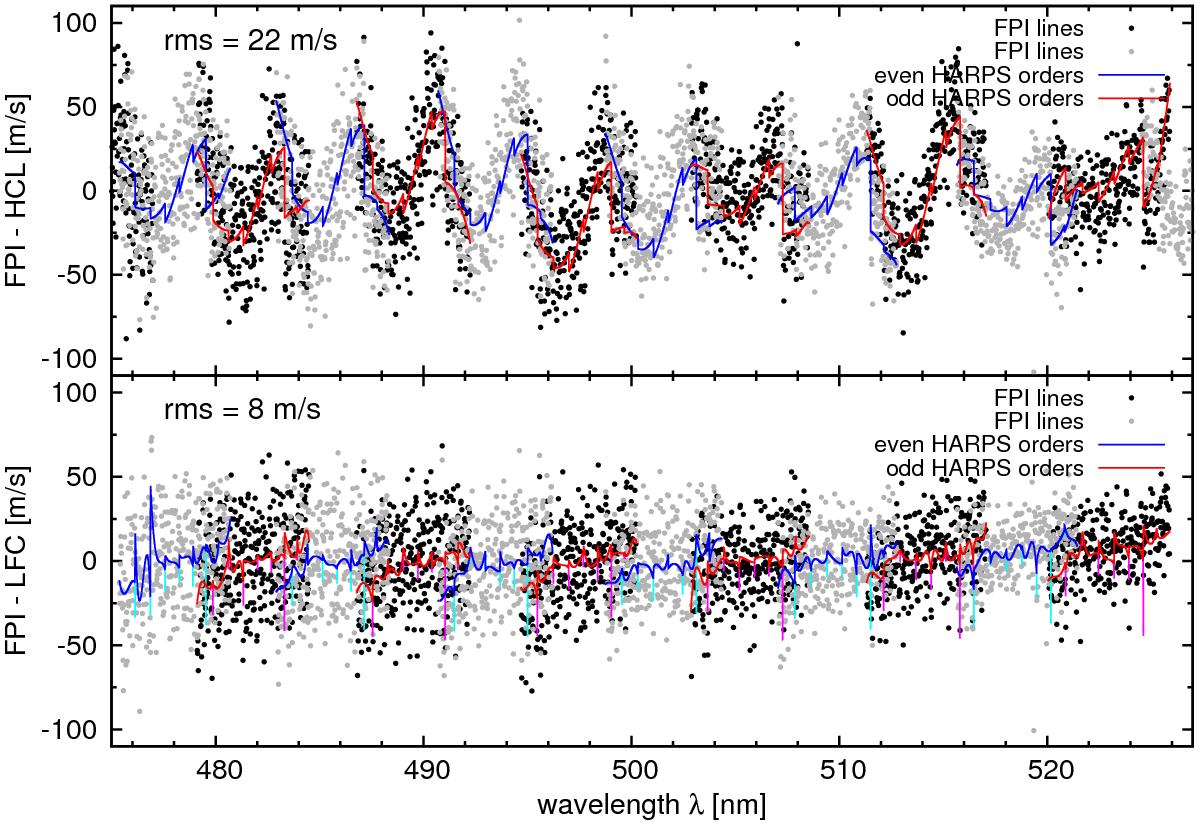
Upper panel: difference between our FPI wavelength solution and the DRS wavelength solution (solid lines) with an rms of 22 m/s. Difference between FPI wavelengths obtained from the model d(k) and the wavelengths assigned to the FPI from DRS wavelength solution (points). Lower panel: same as above, but using the LFC wavelength solution of Molaro et al. (2013). Orders 116−128 are shown here.
Current usage metrics show cumulative count of Article Views (full-text article views including HTML views, PDF and ePub downloads, according to the available data) and Abstracts Views on Vision4Press platform.
Data correspond to usage on the plateform after 2015. The current usage metrics is available 48-96 hours after online publication and is updated daily on week days.
Initial download of the metrics may take a while.