Free Access
Fig. 4
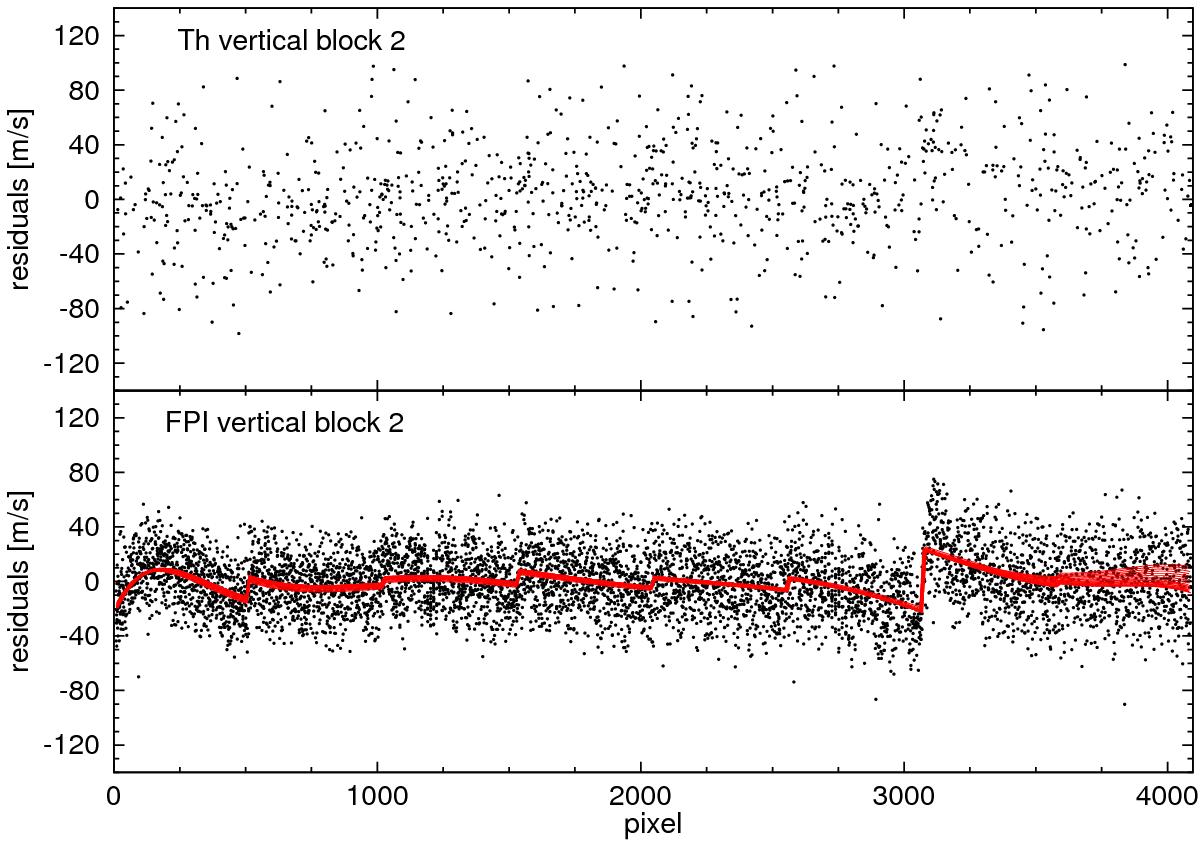
Residuals of Th and FPI positions with respect to a simple polynomial wavelength solution for HARPS orders 116−135 (black dots). The difference in the wavelength solutions between the polynomial model and the model with variable pixel sizes (red lines) shows the captured systematics.
Current usage metrics show cumulative count of Article Views (full-text article views including HTML views, PDF and ePub downloads, according to the available data) and Abstracts Views on Vision4Press platform.
Data correspond to usage on the plateform after 2015. The current usage metrics is available 48-96 hours after online publication and is updated daily on week days.
Initial download of the metrics may take a while.