Fig. 3
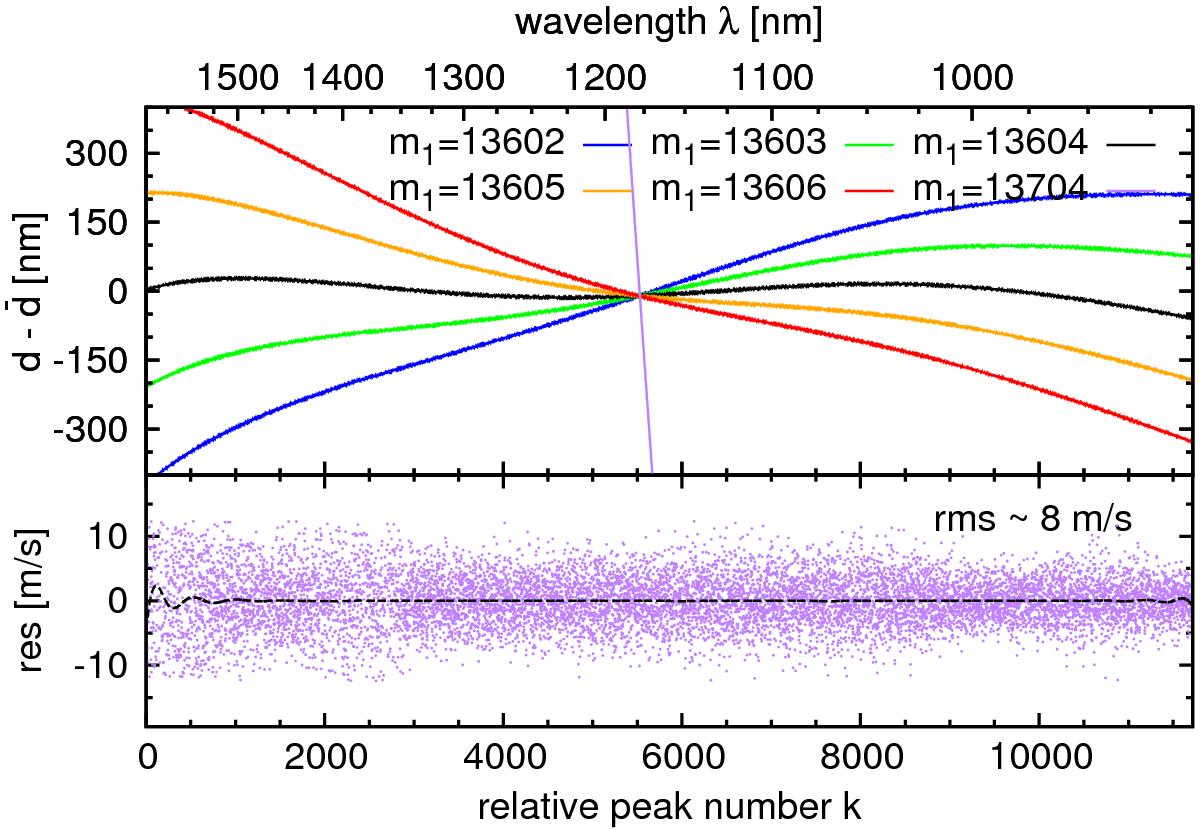
Upper panel: effective cavity width d(k) obtained for different absolute interference order numbers m1. The reference curve (m1 = 13 604, black) is shown in Fig. 2. Lower panel: difference in modeled FPI peak wavelength λm using m1 = 13 704 with the reference curve (dashed line). Residuals of the spline fit to the cavity width d(k) obtained with m1 = 13 704 are shown as purple dots.
Current usage metrics show cumulative count of Article Views (full-text article views including HTML views, PDF and ePub downloads, according to the available data) and Abstracts Views on Vision4Press platform.
Data correspond to usage on the plateform after 2015. The current usage metrics is available 48-96 hours after online publication and is updated daily on week days.
Initial download of the metrics may take a while.