Fig. 2
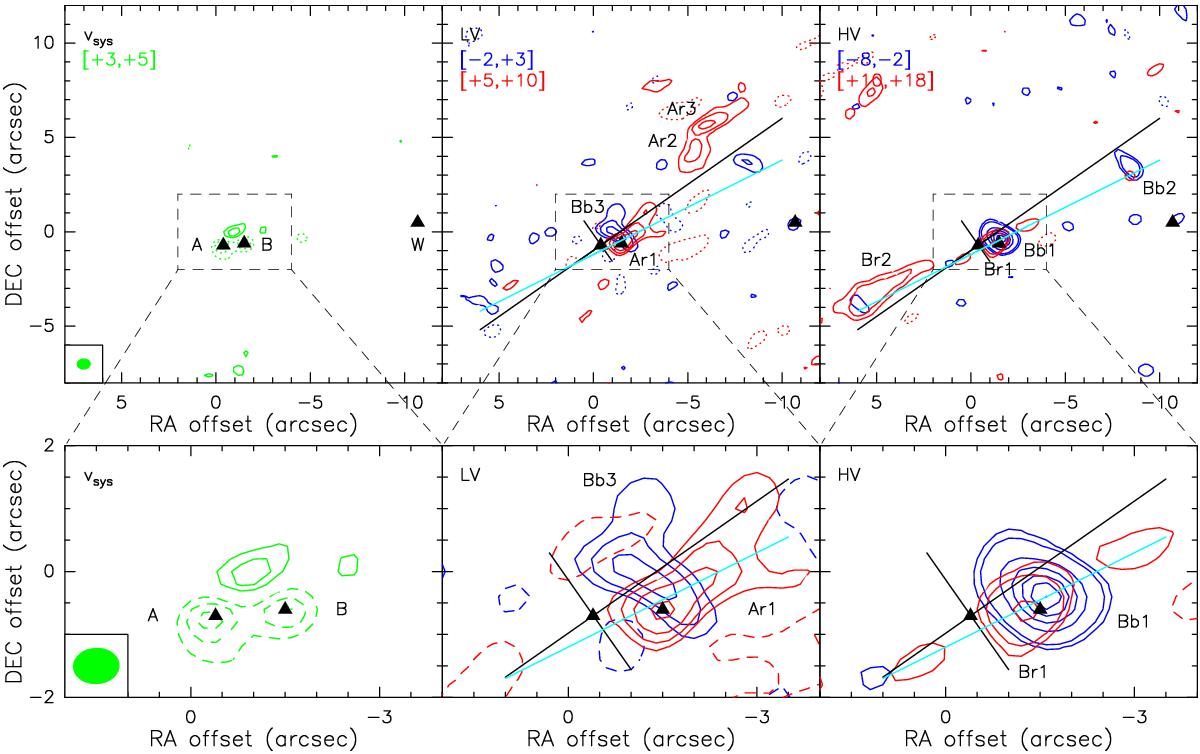
Channel maps of the ALMA CO(2−1) emission integrated over three velocity ranges: systemic velocity in the left panels (vsys ± 1 km s-1, where the systemic velocity is 3.6 km s-1, see Yu & Chernin 1997; Narayanan & Logan 2006), low-velocity in the middle panels (LV; −2, +3 km s-1 and +5, +10 km s-1), and high-velocity in the right panels (HV; −8, −2 km s-1, and +10, +18 km s-1). Offsets are given with respect to the pointing coordinates, i.e. αJ2000 = 16h26m26![]() 419 and δJ2000 = −24°24′29
419 and δJ2000 = −24°24′29![]() 99. Contour levels of emission are traced at 3, 5, and 8σ levels and increase in steps of 5σ, with the exception of the HV panels where they are shown at 3 and 5σ and increase in steps of 10σ. Negative contours are displayed with dotted (upper) and dashed (lower) lines starting at 3σ level and decreasing in steps of 3σ. The ALMA synthesised beam of the CO map is shown in the left panels. Black triangles represent the three protostellar sources, which are labelled in the left panel. Other labels indicate the CO features discussed in the text. Black and cyan solid lines are the same as in Fig. 1.
99. Contour levels of emission are traced at 3, 5, and 8σ levels and increase in steps of 5σ, with the exception of the HV panels where they are shown at 3 and 5σ and increase in steps of 10σ. Negative contours are displayed with dotted (upper) and dashed (lower) lines starting at 3σ level and decreasing in steps of 3σ. The ALMA synthesised beam of the CO map is shown in the left panels. Black triangles represent the three protostellar sources, which are labelled in the left panel. Other labels indicate the CO features discussed in the text. Black and cyan solid lines are the same as in Fig. 1.
Current usage metrics show cumulative count of Article Views (full-text article views including HTML views, PDF and ePub downloads, according to the available data) and Abstracts Views on Vision4Press platform.
Data correspond to usage on the plateform after 2015. The current usage metrics is available 48-96 hours after online publication and is updated daily on week days.
Initial download of the metrics may take a while.