Fig. 1
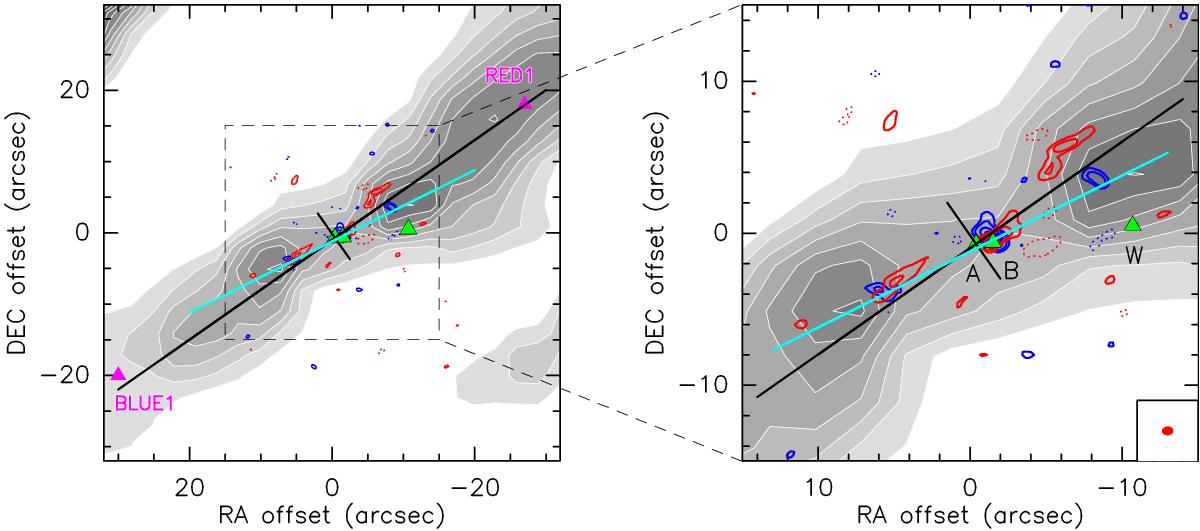
ALMA CO(2−1) emission integrated over the blue- (−8, +1 km s-1) and red-shifted (+5, +18 km s-1) velocity ranges are compared with the PACS [Oi] emission line at 63 μm by Nisini et al. (2015). The ALMA synthesised beam of the CO map is shown in the right panel. Green triangles indicate the positions of the three sources, as reported by Murillo et al. (2013b); magenta triangles label the closest CO knots identified by André et al. (1990). Black lines indicate the directions of the VLA1623A disk (PA = 35°, Murillo & Lai 2013a; Murillo et al. 2013b) and the relative outflow (PA = 125°). The latter is consistent with the large-scale CO outflow direction and with the secondary [Oi] 63 μm peaks, whereas the closest [Oi] 63 μm emission peaks are misaligned. The cyan line indicates the direction of the collimated jet (Br1 and Bb1 CO knots from Fig. 2), which is not associated with the large-scale CO outflow direction and with the direction perpendicular to the A disk, but it is rather associated with the closest [Oi] 63 μm emission peaks.
Current usage metrics show cumulative count of Article Views (full-text article views including HTML views, PDF and ePub downloads, according to the available data) and Abstracts Views on Vision4Press platform.
Data correspond to usage on the plateform after 2015. The current usage metrics is available 48-96 hours after online publication and is updated daily on week days.
Initial download of the metrics may take a while.