Fig. 5
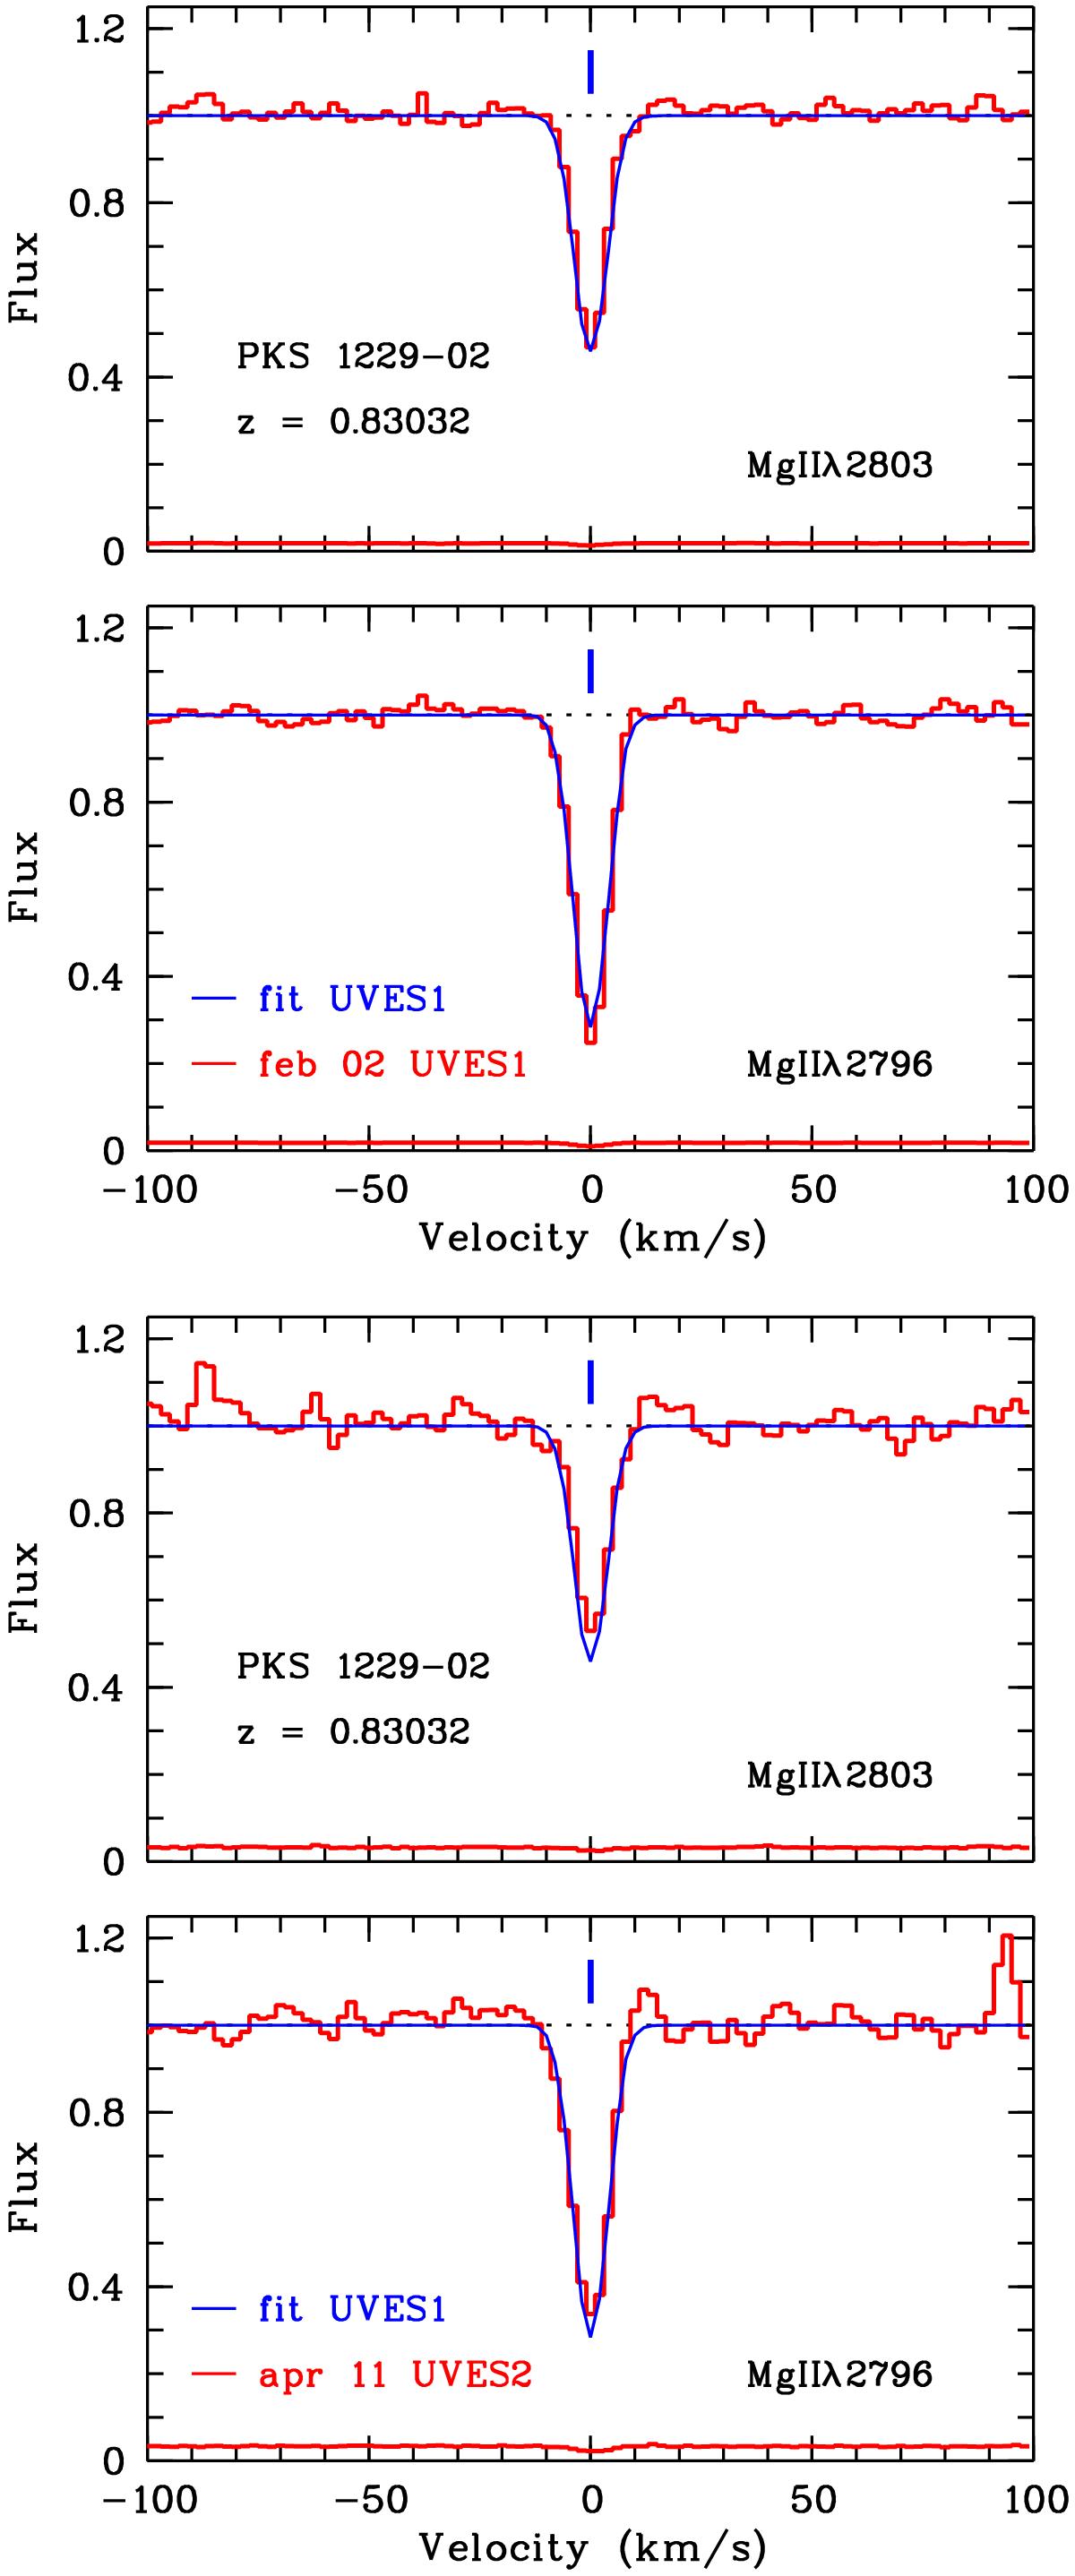
Intervening Mg ii absorption at zabs = 0.83032 towards PKS 1229−02: spectrum and its error (red curves), together with a simultaneous fit to both transitions (blue curve). In the upper panel, we show the UVES 2002 data, while the bottom panel displays the UVES 2011 data with the fit performed on the UVES 2002 spectrum. The blue vertical tick underlines the marginally variable Mg ii doublet.
Current usage metrics show cumulative count of Article Views (full-text article views including HTML views, PDF and ePub downloads, according to the available data) and Abstracts Views on Vision4Press platform.
Data correspond to usage on the plateform after 2015. The current usage metrics is available 48-96 hours after online publication and is updated daily on week days.
Initial download of the metrics may take a while.