Fig. 3
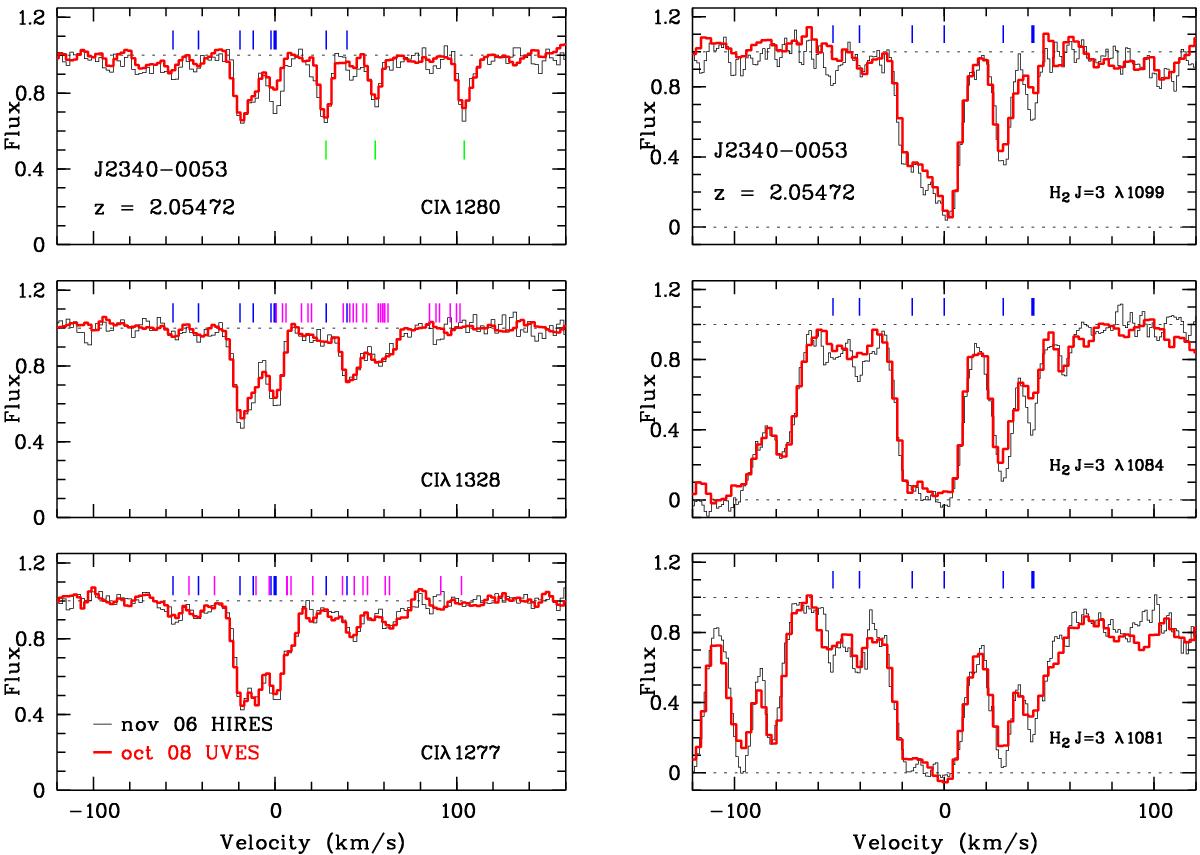
C iλ1277,1280,1328 and molecular H2, J = 3λ1081,1084,1081 absorptions at zabs = 2.05472 towards FBQS J2340−0053 in the November 2006 (HIRES, black line) and October 2008 (UVES, red line) spectra. Left panel: the eight C i components required to fit the profiles are shown by blue ticks, and the marginally varying feature is at v = 0 (thick tick). In the top C iλ1280 plot, three C iλ1656 lines from the zabs = 1.3606 system are also shown (green ticks). For the C iλ1277 and C iλ1328 transitions, we show the position expected for C i∗ transitions associated with the 8 components (cyan ticks). The features at v ≃ 40 km s-1 are mainly due to C i∗ transitions. Right panel: six H2J = 3 components are required to fit the profiles. Marginal variability is seen in the sixth component (thick tick) at v ≃ 40 km s-1. Some difference is also seen in the fifth component, but it is significant only at the 2.0σ level, instead of 3.1σ for the sixth one. For both narrow components displaying marginal variations in C i (v ≃ 0) or H2 (v ≃ 40 km s-1), we checked that the slightly higher resolution of the HIRES spectrum cannot account for the observed difference between the profiles.
Current usage metrics show cumulative count of Article Views (full-text article views including HTML views, PDF and ePub downloads, according to the available data) and Abstracts Views on Vision4Press platform.
Data correspond to usage on the plateform after 2015. The current usage metrics is available 48-96 hours after online publication and is updated daily on week days.
Initial download of the metrics may take a while.