Fig. 2
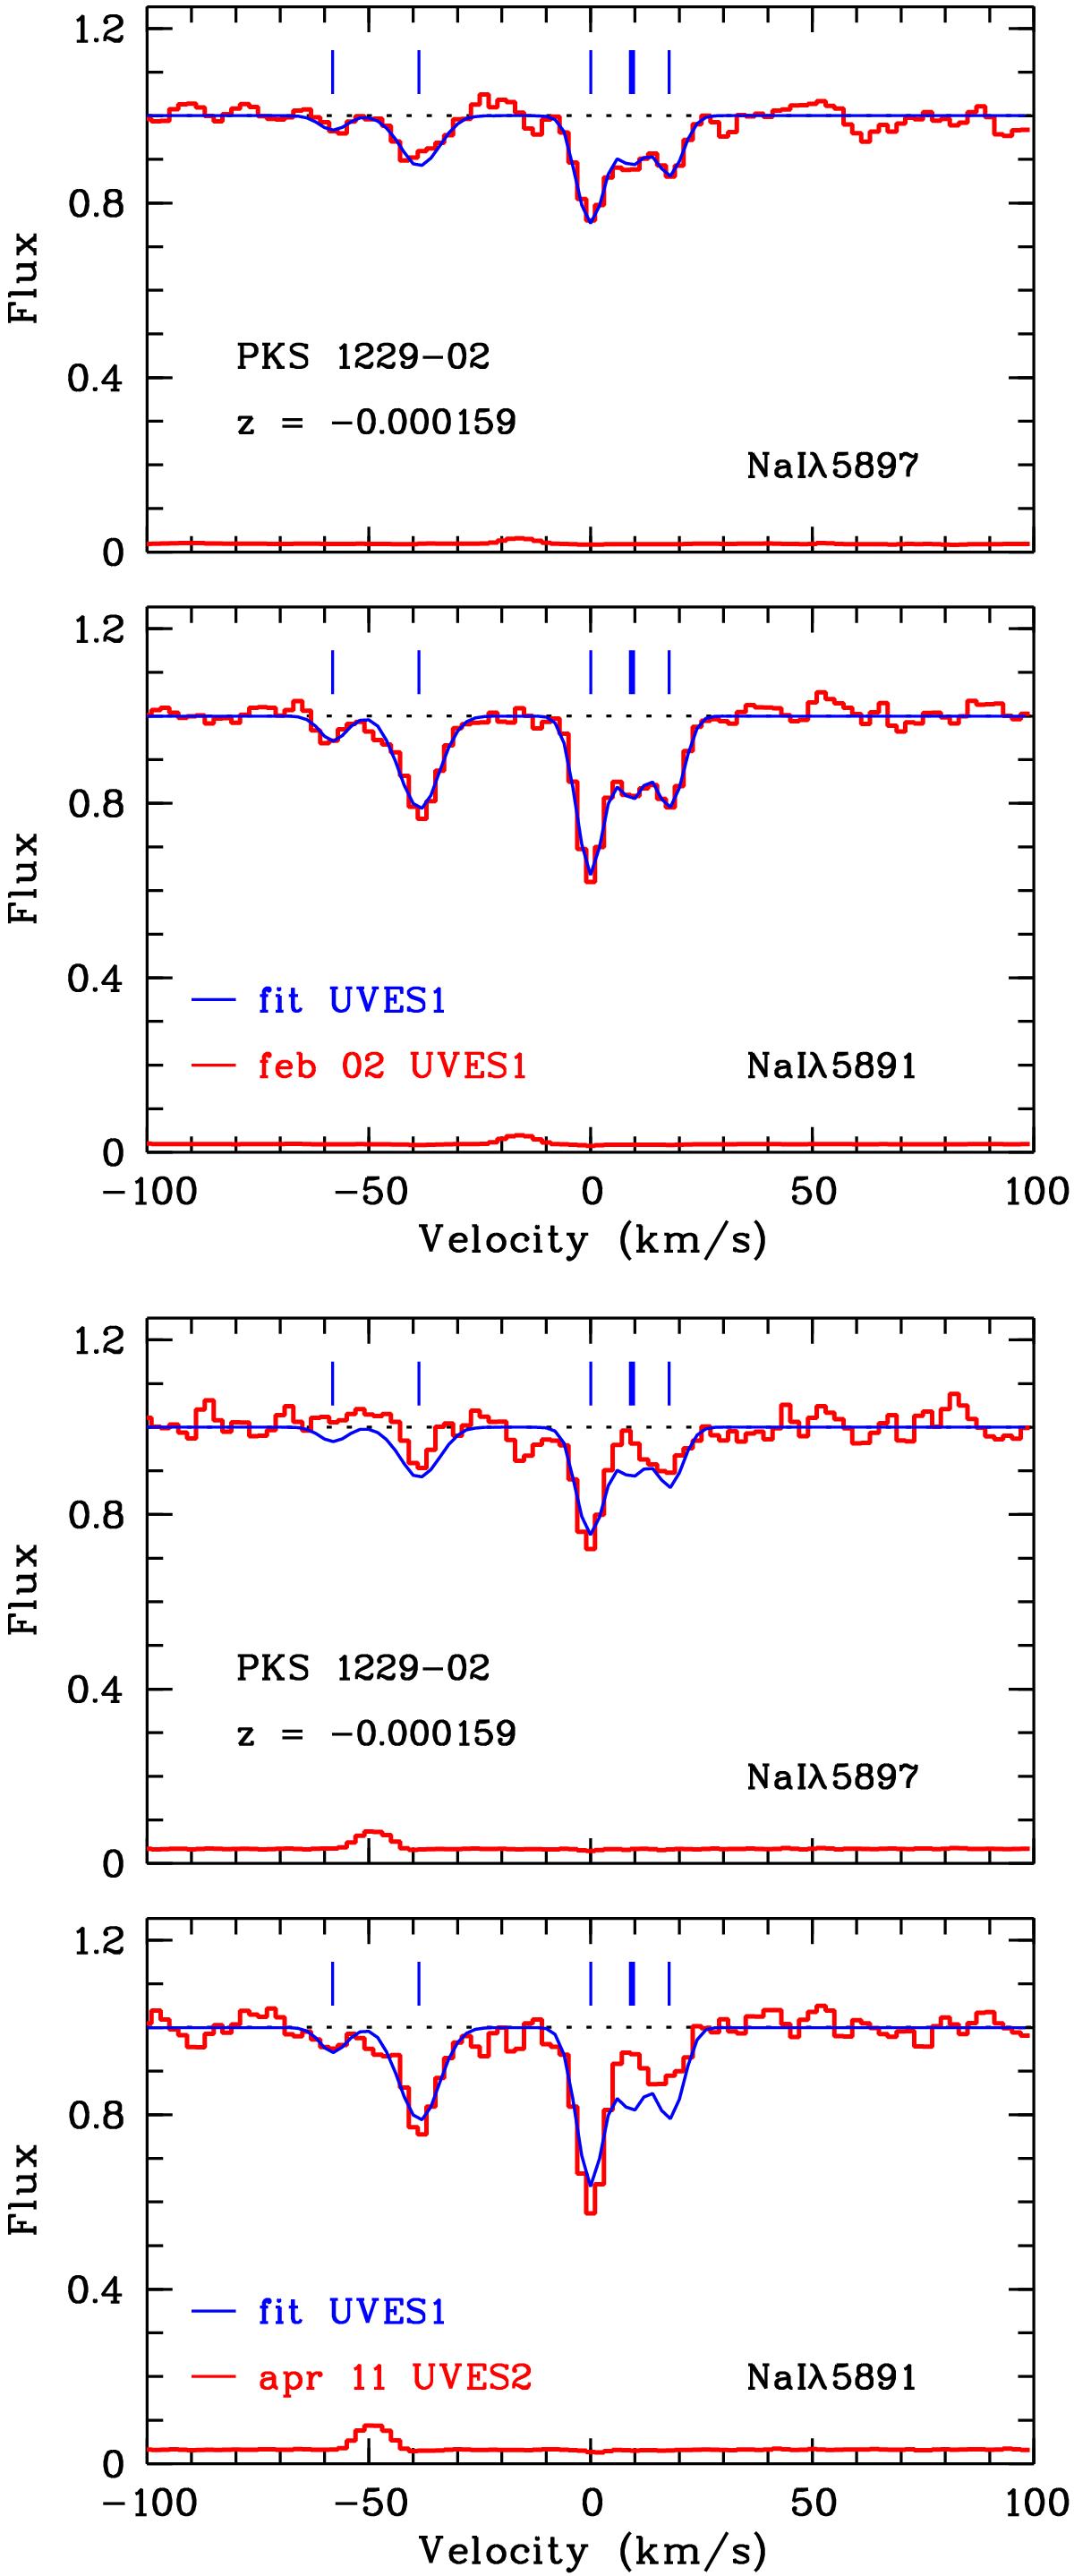
Galactic Na i absorption toward PKS 1229−02: spectrum, its error (red curves) and simultaneous fit to both transitions (blue curve). The UVES 2002 data are shown in the top panel; in the bottom panel we display the UVES 2011 data together with the fits to the 2002 data (blue). Note the disappearance of the component at vhelio = 9.6 km s-1 (thick vertical tick mark), within a period of 9.2 yr. The heliocentric redshift z = −0.000159 (strongest component) corresponds to v = 0 km s-1.
Current usage metrics show cumulative count of Article Views (full-text article views including HTML views, PDF and ePub downloads, according to the available data) and Abstracts Views on Vision4Press platform.
Data correspond to usage on the plateform after 2015. The current usage metrics is available 48-96 hours after online publication and is updated daily on week days.
Initial download of the metrics may take a while.