Fig. 8
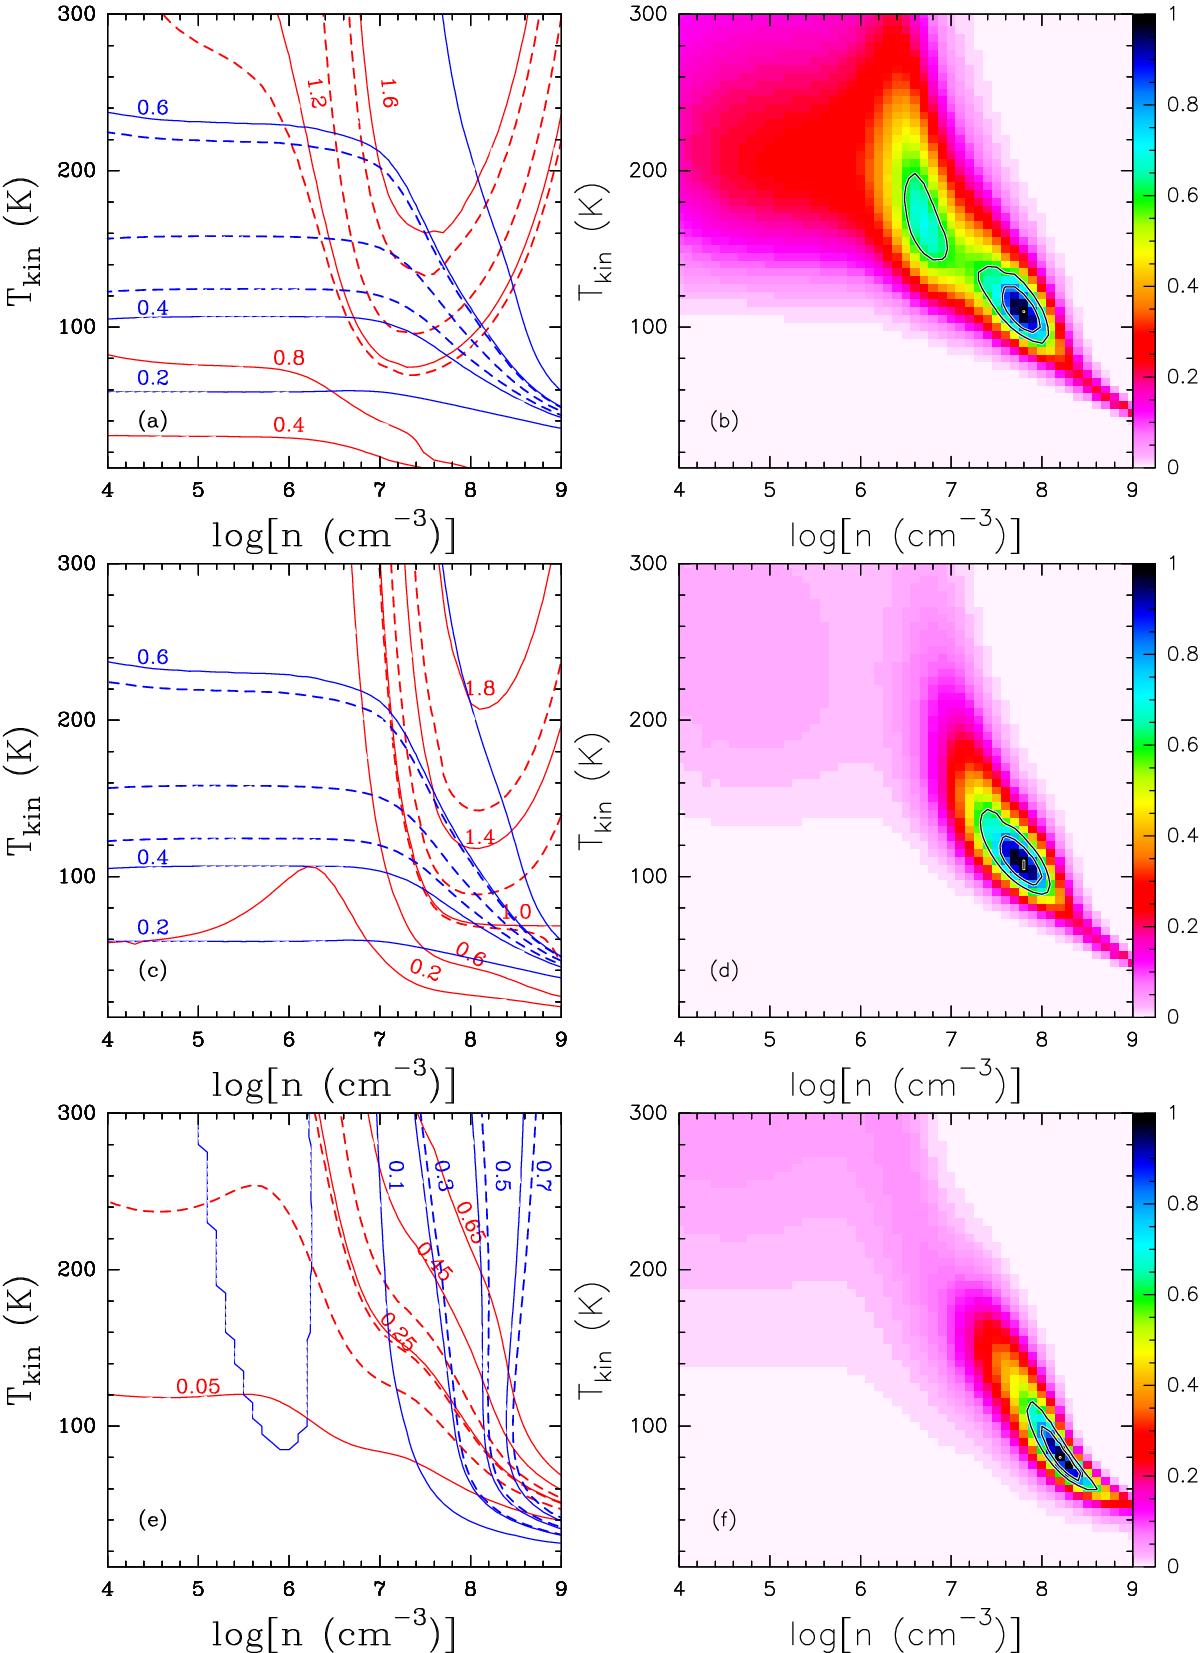
Radex radiative transfer calculations on the excitation of 15NH3. a) The modeled line ratios ![]() (red lines) and
(red lines) and ![]() (blue lines) as a function of nH2 and Tkin. The solid red and blue lines represent the calculated
(blue lines) as a function of nH2 and Tkin. The solid red and blue lines represent the calculated ![]() and
and ![]() line ratios which are labeled. The dashed lines represent observed line ratios and their upper and lower limits. b) The derived likelihood as a function of nH2 and Tkin. Only metastable para–15NH3 transitions are included in the modeling. The likelihood scale is indicated by the color bar. The contours represent the likelihoods 0.6, and 0.8. c) Same as Fig. 8a, but the solid red lines represent the line ratios of
line ratios which are labeled. The dashed lines represent observed line ratios and their upper and lower limits. b) The derived likelihood as a function of nH2 and Tkin. Only metastable para–15NH3 transitions are included in the modeling. The likelihood scale is indicated by the color bar. The contours represent the likelihoods 0.6, and 0.8. c) Same as Fig. 8a, but the solid red lines represent the line ratios of ![]() . d) Same as Fig. 8b, but the non-metastable transitions are also included in the modeling. e) Same as Fig. 8a, but the solid red and blue lines represent the line ratios of
. d) Same as Fig. 8b, but the non-metastable transitions are also included in the modeling. e) Same as Fig. 8a, but the solid red and blue lines represent the line ratios of ![]() and
and ![]() . f) Same as Fig. 8d, but for ortho–15NH3 transitions.
. f) Same as Fig. 8d, but for ortho–15NH3 transitions.


Current usage metrics show cumulative count of Article Views (full-text article views including HTML views, PDF and ePub downloads, according to the available data) and Abstracts Views on Vision4Press platform.
Data correspond to usage on the plateform after 2015. The current usage metrics is available 48-96 hours after online publication and is updated daily on week days.
Initial download of the metrics may take a while.