Fig. 4
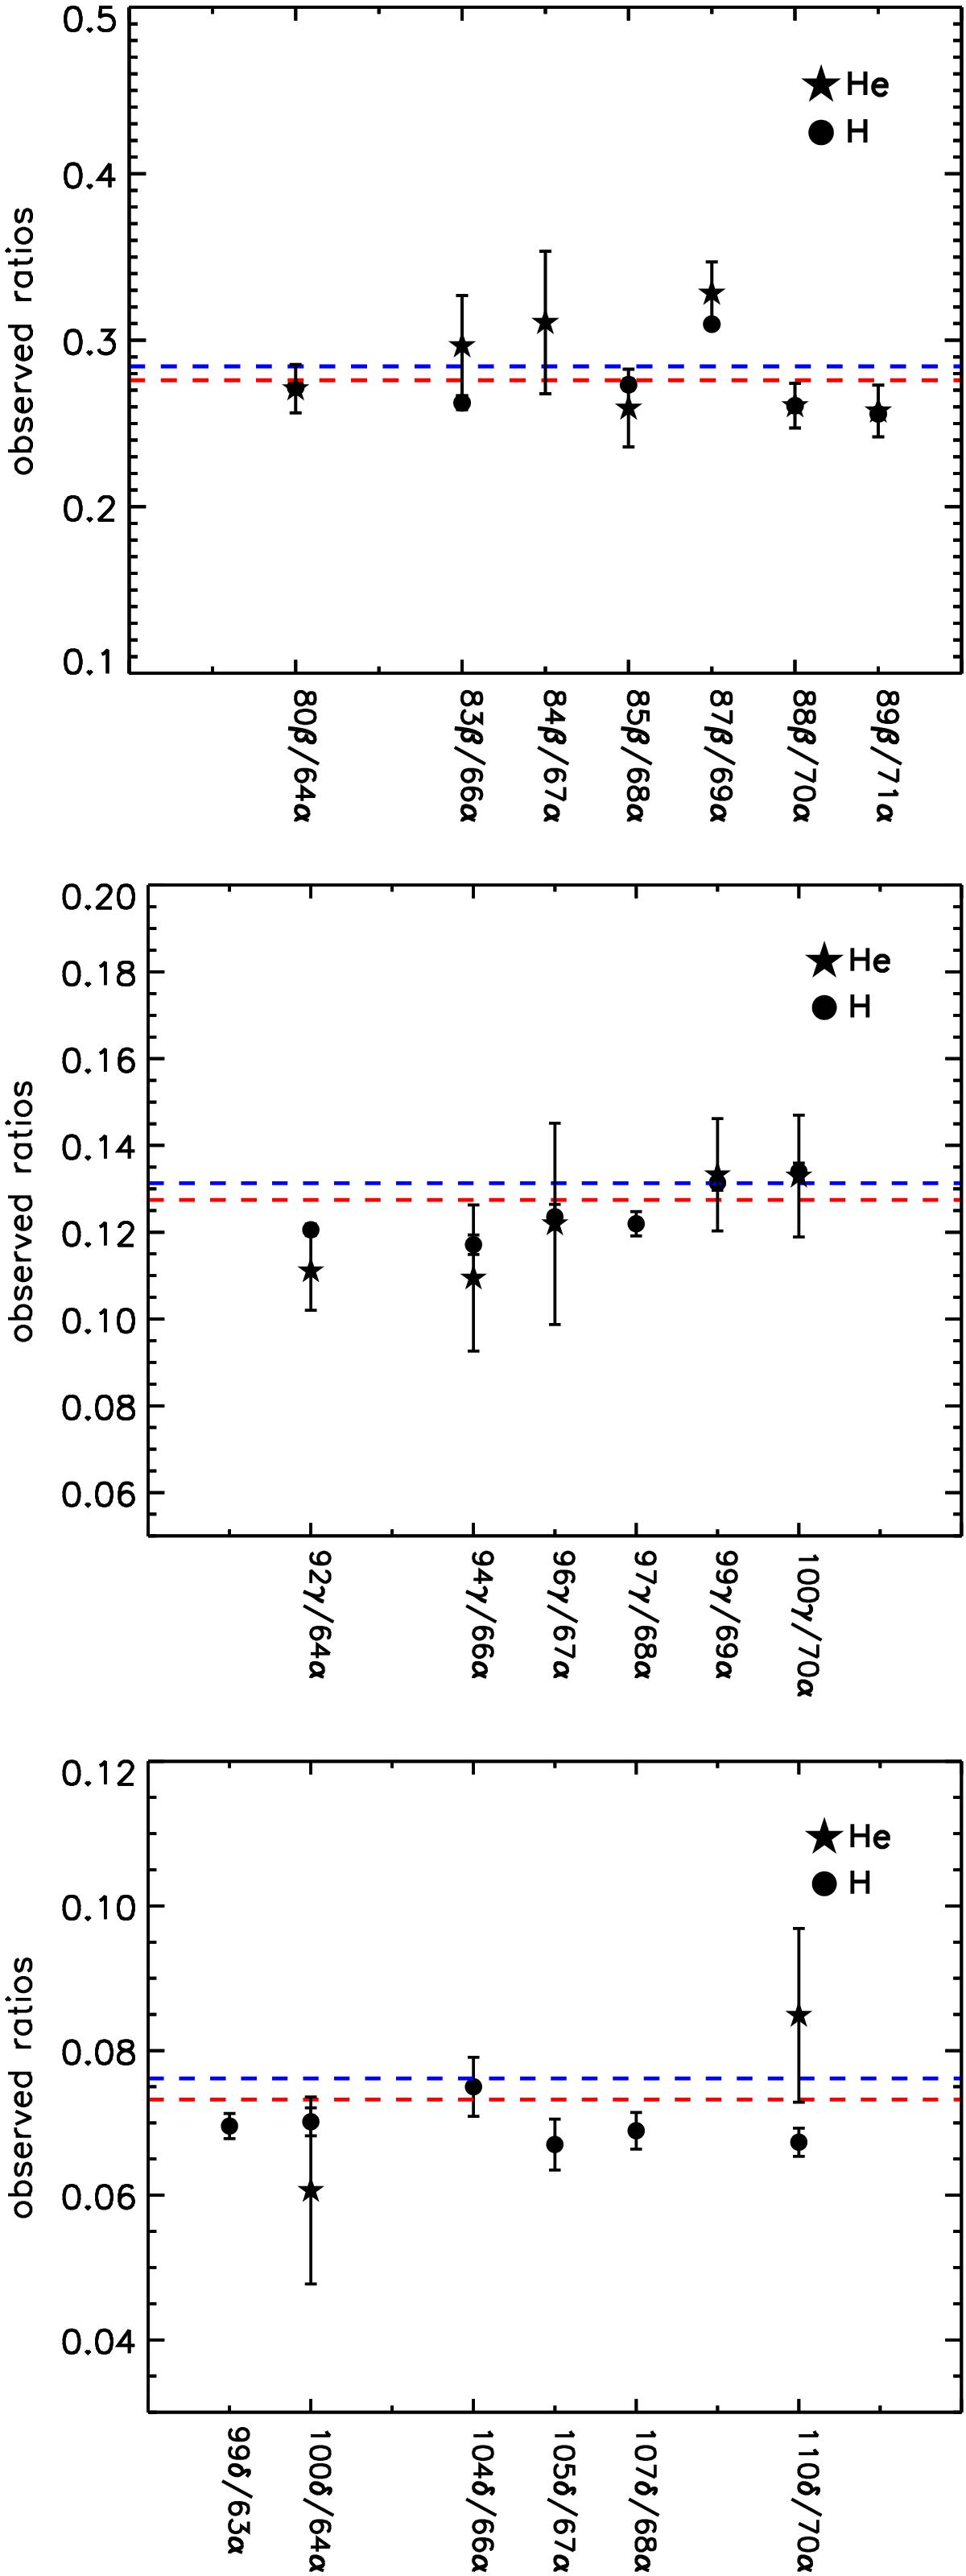
Comparison of observed and LTE ratios of recombination lines. The observed ratios for hydrogen and helium RRLs are indicated with circles and pentagrams. The red dashed lines represent the LTE ratios, while the blue dashed lines represent the LTE ratios with the departure coefficients bn corrected. Each ratio is given below the respective abscissa.


Current usage metrics show cumulative count of Article Views (full-text article views including HTML views, PDF and ePub downloads, according to the available data) and Abstracts Views on Vision4Press platform.
Data correspond to usage on the plateform after 2015. The current usage metrics is available 48-96 hours after online publication and is updated daily on week days.
Initial download of the metrics may take a while.