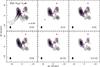
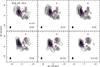
Fig. C.1

Molecular line channel maps (contours) overlaid on the 230 GHz continuum map (grey). Grey shadings of the continuum image are 10%, 20%, 40%, 60%, 80% of the peak intensity of 1.406 Jy beam-1. The contour levels of the molecular line images start at 5σ and continue in steps of 5σ, where the σ value for each transition is shown in the first panel in units of Jy beam-1. The dotted contours are the negative features with the same contour absolute levels as the positive ones in each panel. The symbols are the same as in Fig. 1. The corresponding molecular transitions are indicated in the upper left of the first panel. The velocity range is given in the lower right of each panel in km s-1. The synthesized beams of the molecular line images are shown in the lower left of each panel. The (0, 0) position in each panel is (αJ2000, δJ2000) = (05h35m14.350s, −05°22′35.00′′).
Current usage metrics show cumulative count of Article Views (full-text article views including HTML views, PDF and ePub downloads, according to the available data) and Abstracts Views on Vision4Press platform.
Data correspond to usage on the plateform after 2015. The current usage metrics is available 48-96 hours after online publication and is updated daily on week days.
Initial download of the metrics may take a while.