Fig. 6
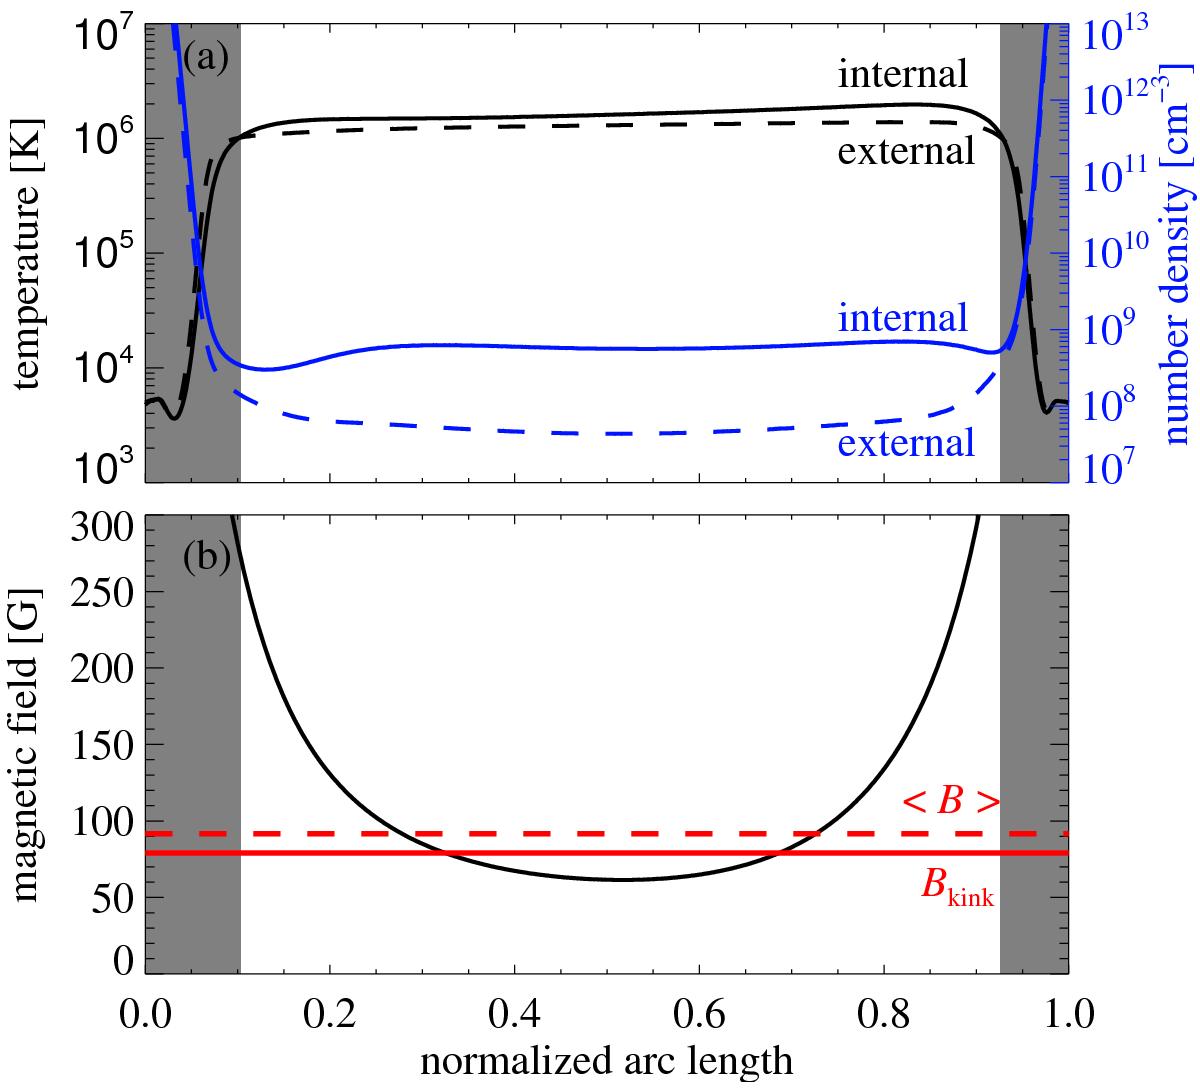
Plasma parameters and magnetic field strength along the loop. Panel a) shows the temperature (black) and density (blue) for the condition inside the EUV loop (solid lines labelled internal). The corresponding values just outside the loop are plotted as dashed lines (labelled external). Panel b) shows the magnetic field strength along the loop in the 3D MHD model. The red solid line shows the coronal magnetic field strength derived from the kink oscillation, Bkink, and the red dashed line indicates the average magnetic field strength, ⟨ B ⟩, defined by Eq. (8). The position along the loop is normalised by the total loop length (53 Mm). The positions 0.0 and 1.0 are at footpoints in the photosphere. The grey areas indicate the lower atmosphere, where T< 1 MK. The loop length in the coronal part, i.e. between the grey regions, is about 45 Mm. See Sect. 3.3 for panel a) and Sects. 4.1 and 4.2 for panel b).
Current usage metrics show cumulative count of Article Views (full-text article views including HTML views, PDF and ePub downloads, according to the available data) and Abstracts Views on Vision4Press platform.
Data correspond to usage on the plateform after 2015. The current usage metrics is available 48-96 hours after online publication and is updated daily on week days.
Initial download of the metrics may take a while.