Fig. 5
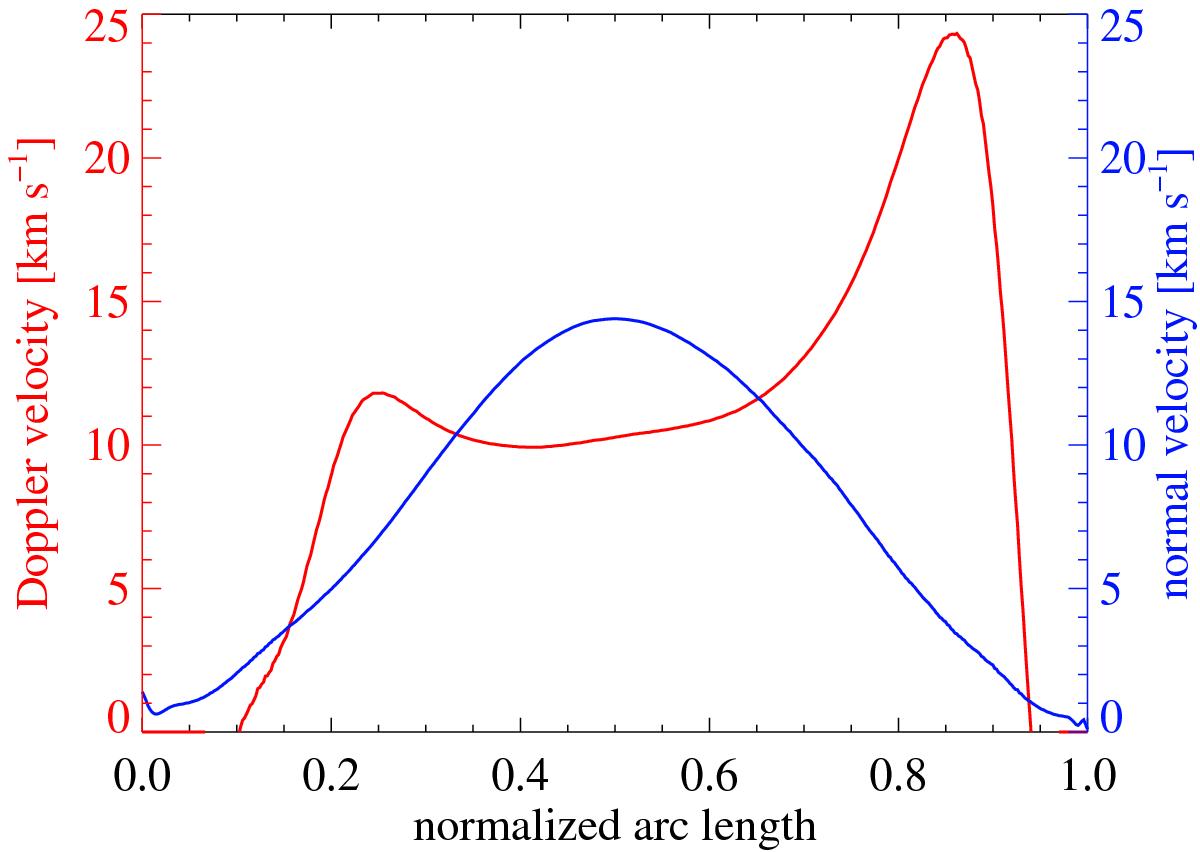
Line-of-sight Doppler shift and normal velocity of the oscillation along the loop. The blue curve shows the velocity of the oscillating loop in the normal direction at a snapshot of maximum velocity amplitude (at t = 200 s). The red line indicates the Doppler shifts from the synthesised spectral profiles, basically the vertical velocity in the loop, which also show signs of the field-aligned flows near the footpoints. The arc length has been normalised to the loop length, i.e. the footpoints in the photosphere are at 0 and 1, and the apex is around 0.5. See Sect. 3.4.
Current usage metrics show cumulative count of Article Views (full-text article views including HTML views, PDF and ePub downloads, according to the available data) and Abstracts Views on Vision4Press platform.
Data correspond to usage on the plateform after 2015. The current usage metrics is available 48-96 hours after online publication and is updated daily on week days.
Initial download of the metrics may take a while.