Fig. 4
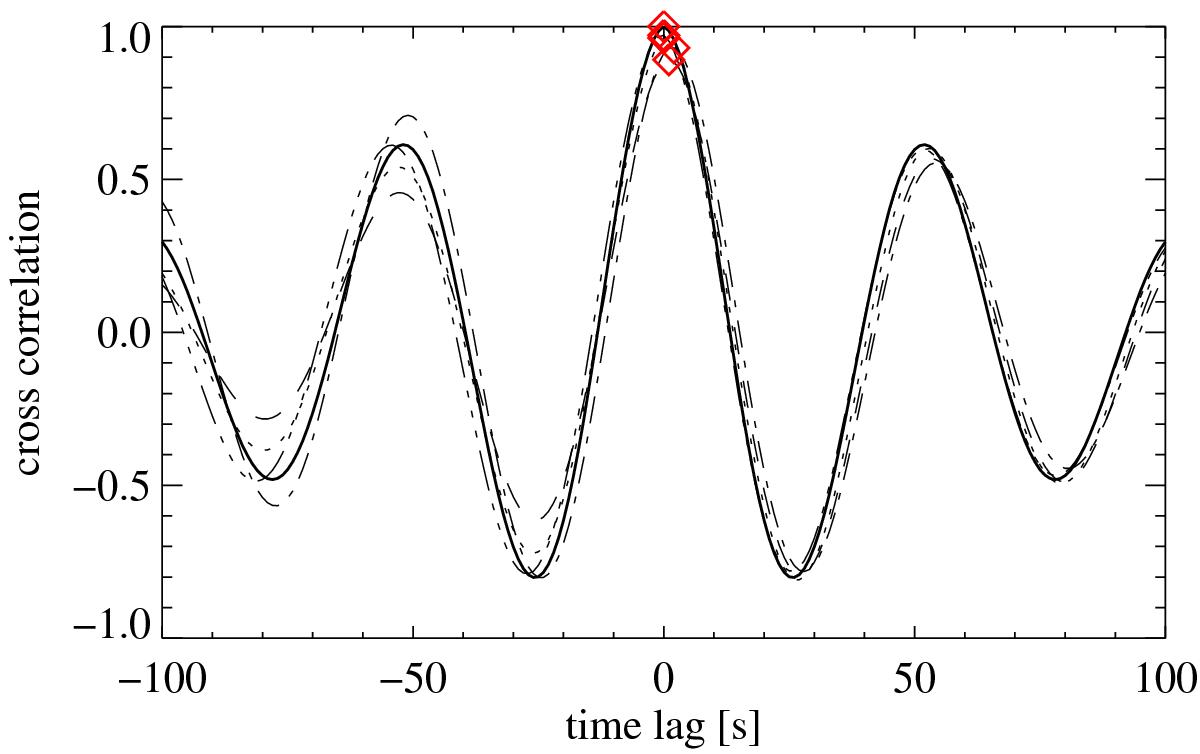
Cross correlations of the oscillation at different locations along the loop. The five curves show the cross correlation of the loop apex with five positions along the loop (apex, two positions midway from apex to loop, and two near the footpoint at both sides). The solid line shows the self-correlation at the loop apex. The range of the time lag shown here is about four times the oscillation period of 52.5 s at the loop apex. The red diamonds indicate the peaks of the cross-correlation functions. See Sect. 3.4.
Current usage metrics show cumulative count of Article Views (full-text article views including HTML views, PDF and ePub downloads, according to the available data) and Abstracts Views on Vision4Press platform.
Data correspond to usage on the plateform after 2015. The current usage metrics is available 48-96 hours after online publication and is updated daily on week days.
Initial download of the metrics may take a while.