Fig. 3
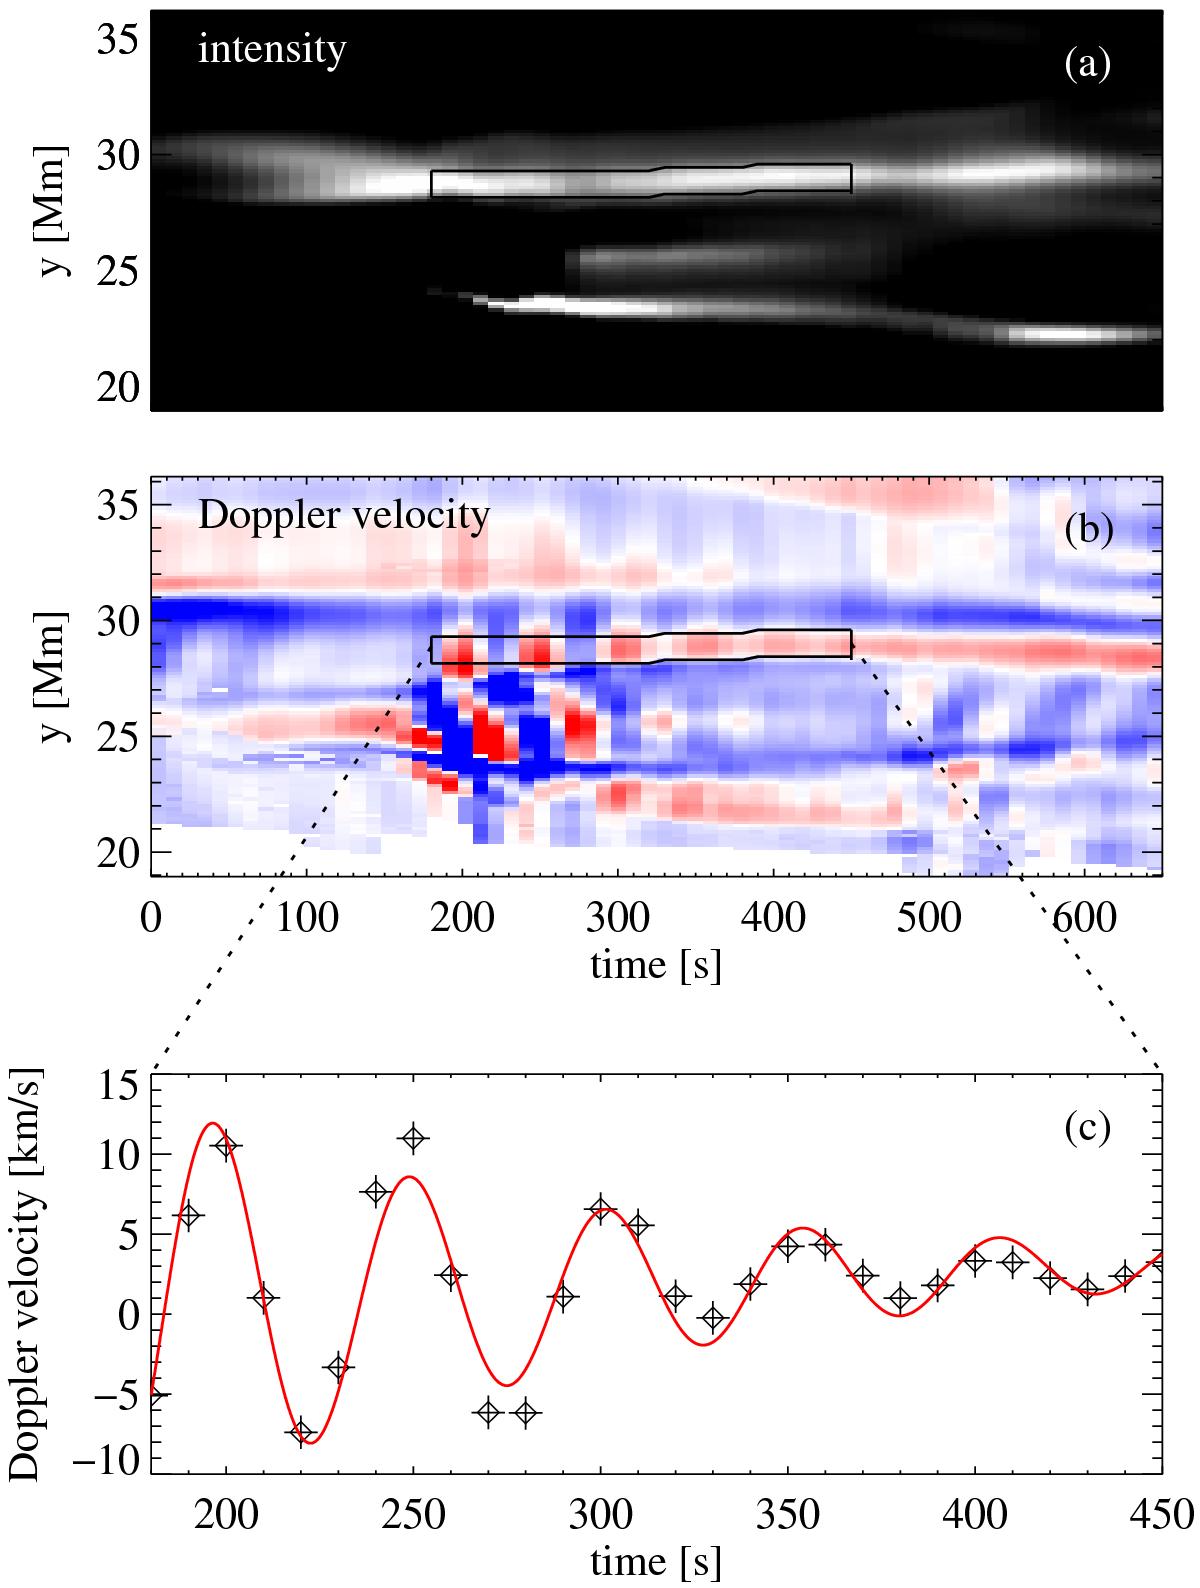
Oscillation of the loop. Panels a) and b) show the intensity and Doppler shift of the Fe xiii line synthesised from the coronal model as a function of time and space along the slit. The location of the slit is indicated in Fig. 2 and the range of Doppler shifts is from −15 km s-1 to + 15 km s-1, just as in Fig. 2. The black boxes in these space-time plots indicate the position of the loop with the clearest oscillation pattern. Panel c) shows the Doppler shift of the loop as a function of time. Here the Doppler shifts are averaged along the slit across the loop, i.e. along y within the black box in panel b). The red line shows the fit by a damped sinusoidal function as defined in Eq. (3). See Sect. 3.3.
Current usage metrics show cumulative count of Article Views (full-text article views including HTML views, PDF and ePub downloads, according to the available data) and Abstracts Views on Vision4Press platform.
Data correspond to usage on the plateform after 2015. The current usage metrics is available 48-96 hours after online publication and is updated daily on week days.
Initial download of the metrics may take a while.