Fig. 2
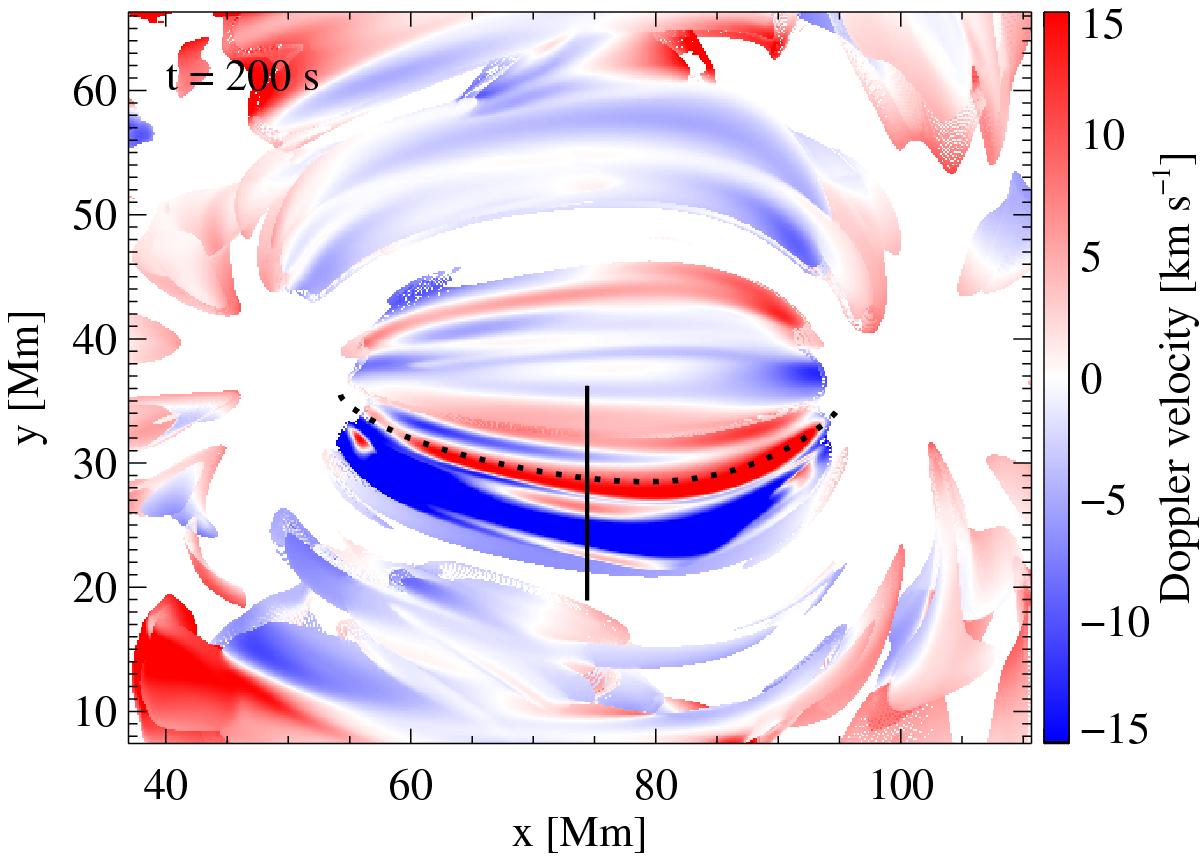
Map of Doppler shifts of synthesised Fe xiii 202 Å data. This shows the active region seen from straight above, i.e. the line of sight is vertical, corresponding to an observation at disk centre. The black solid line indicates the position of the slit used to simulate a sit-and-stare observation for the analysis of the Doppler oscillation (see Fig. 3 and Sect. 3.2). The dotted line indicates the location of the oscillating loop, as seen in the movie attached to Fig. 1.
Current usage metrics show cumulative count of Article Views (full-text article views including HTML views, PDF and ePub downloads, according to the available data) and Abstracts Views on Vision4Press platform.
Data correspond to usage on the plateform after 2015. The current usage metrics is available 48-96 hours after online publication and is updated daily on week days.
Initial download of the metrics may take a while.