Fig. 1
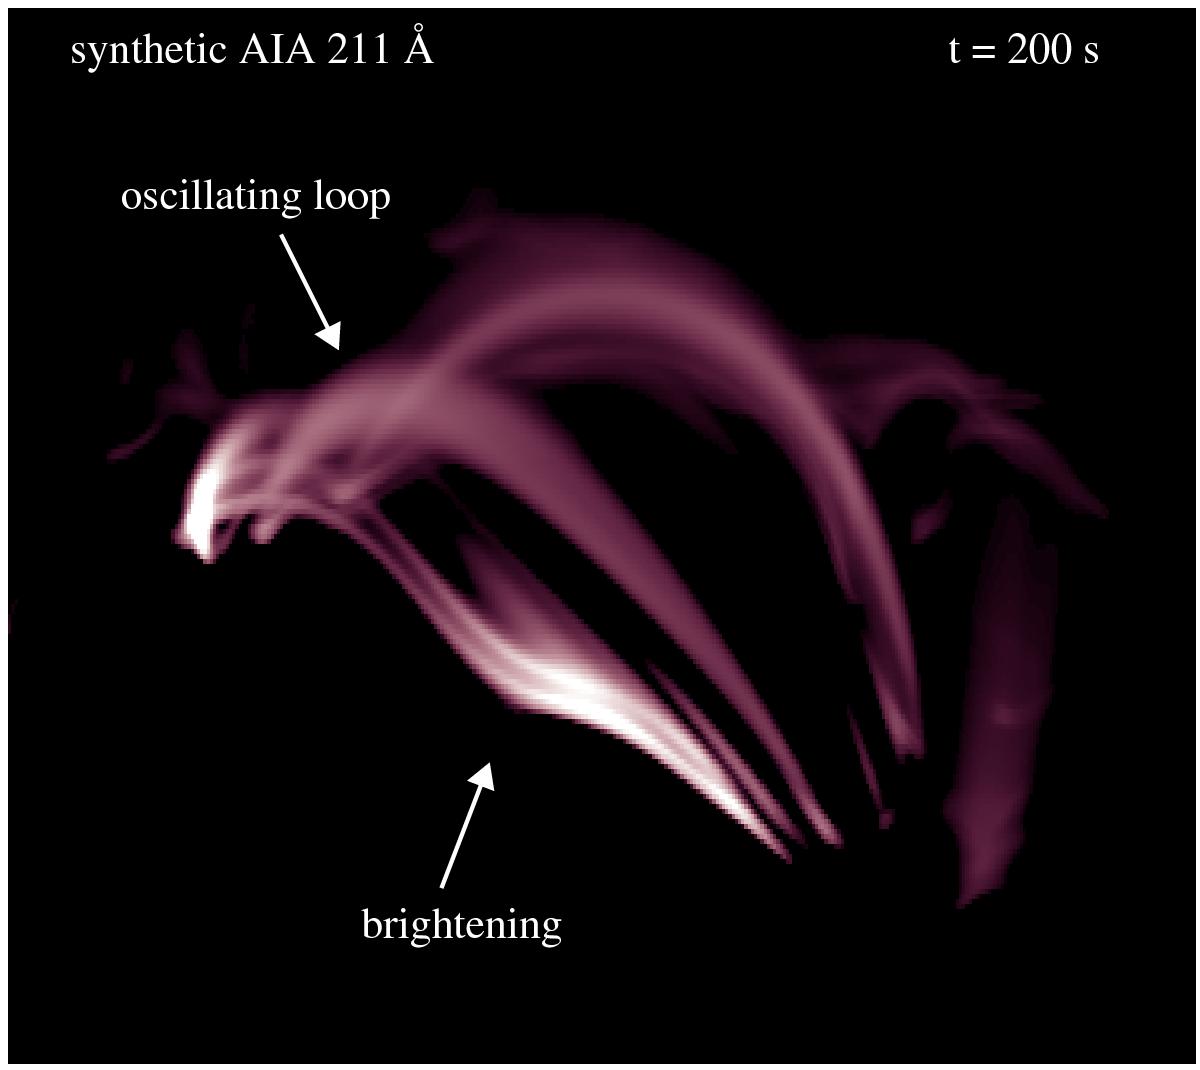
System of coronal loops synthesised from 3D MHD model. This shows a snapshot of the model corona as it would appear in an EUV image taken by AIA in the 211 Å channel (in logarithmic scale). It is dominated by emission from Fe xiii showing plasma at around 2 MK. The distance between the two footpoints of the loop system is about 35 Mm and the loops have lengths of about 45 Mm to 50 Mm. The arrows indicate the position of the brightening, which triggers the oscillation (see Sect. 3.1) and oscillating loop (Sect. 3.3). The full temporal evolution over 54 min is available as a movie in the online edition. The movie starts early in the simulation when there is no coronal emission. In response to the flux emergence, coronal loops form and, at about 72.5 min, a trigger sets the oscillation in motion. Then, a second counter in the movie shows the time in starting at 72.5 min, consistent with the time used in Fig. 3.
Current usage metrics show cumulative count of Article Views (full-text article views including HTML views, PDF and ePub downloads, according to the available data) and Abstracts Views on Vision4Press platform.
Data correspond to usage on the plateform after 2015. The current usage metrics is available 48-96 hours after online publication and is updated daily on week days.
Initial download of the metrics may take a while.