Fig. 2
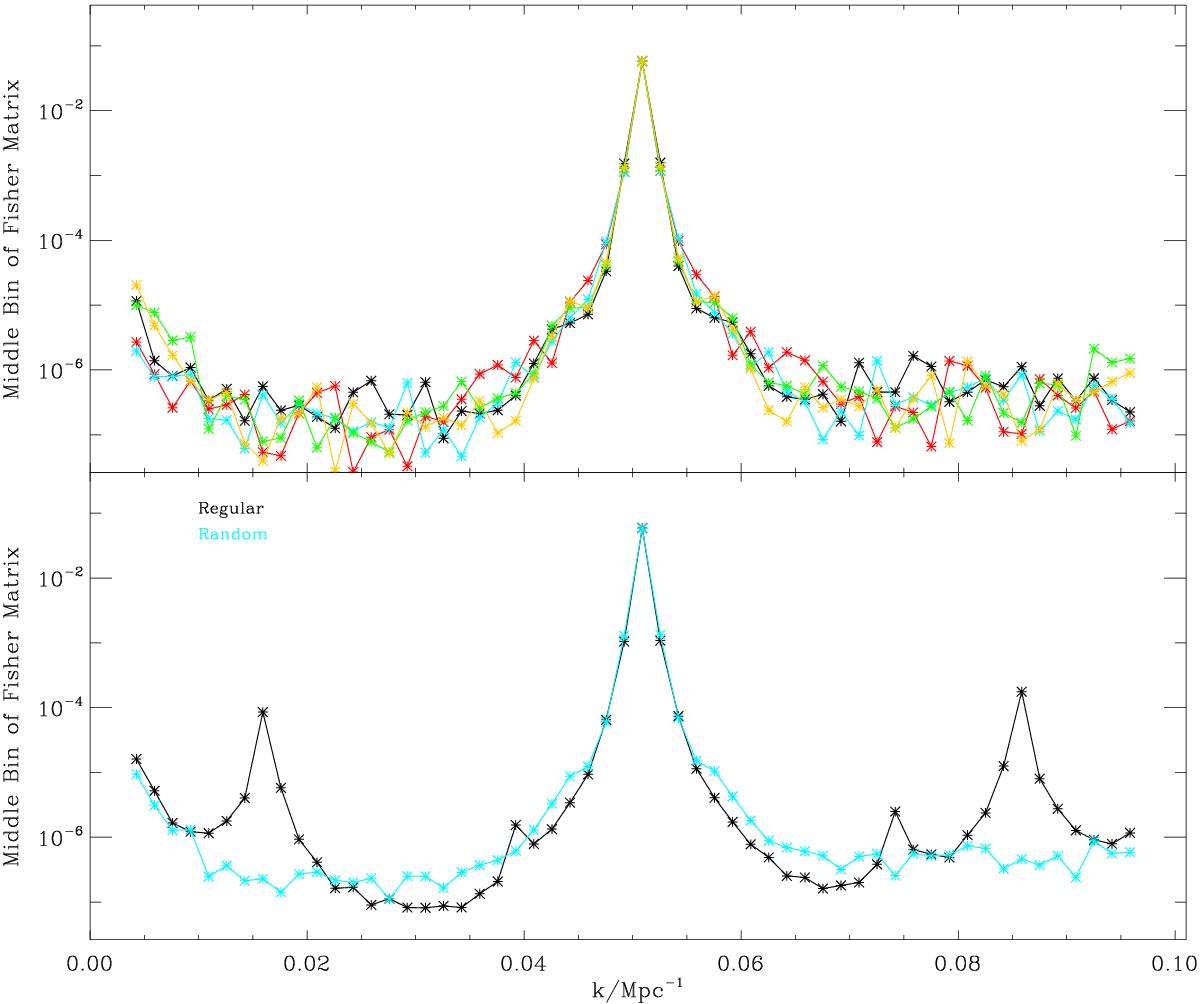
Top panel: middle row of the power spectrum Fisher matrix Fij for five realisations of the random sparse sampling. The main peak in the middle is the inverse error of the middle bin of the power spectrum 1 /σii. Moving away from the main peak, each point represents the correlation between that bin and the middle one 1 /σij. Bottom panel: same for regular (black) and average of the realisations of the random (blue) sampling. In the case of regular sampling, there are secondary peaks at specific scales, which is a consequence of the fixed position of the patches. On the other hand, for random sampling, there is no preferred scale and correlation is evenly distributed between all scales. The symmetric shoulders on the main peak, at k ≃ 0.037 Mpc-1 and k ≃ 0.06 Mpc-1, in the random case are due to the design of the random mask, which has been obtained by a reflection in the x and y plane for simplicity (see main text). Note that the y-axis is in log scale.
Current usage metrics show cumulative count of Article Views (full-text article views including HTML views, PDF and ePub downloads, according to the available data) and Abstracts Views on Vision4Press platform.
Data correspond to usage on the plateform after 2015. The current usage metrics is available 48-96 hours after online publication and is updated daily on week days.
Initial download of the metrics may take a while.