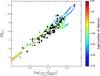
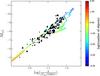
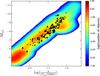
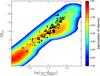
Fig. 8
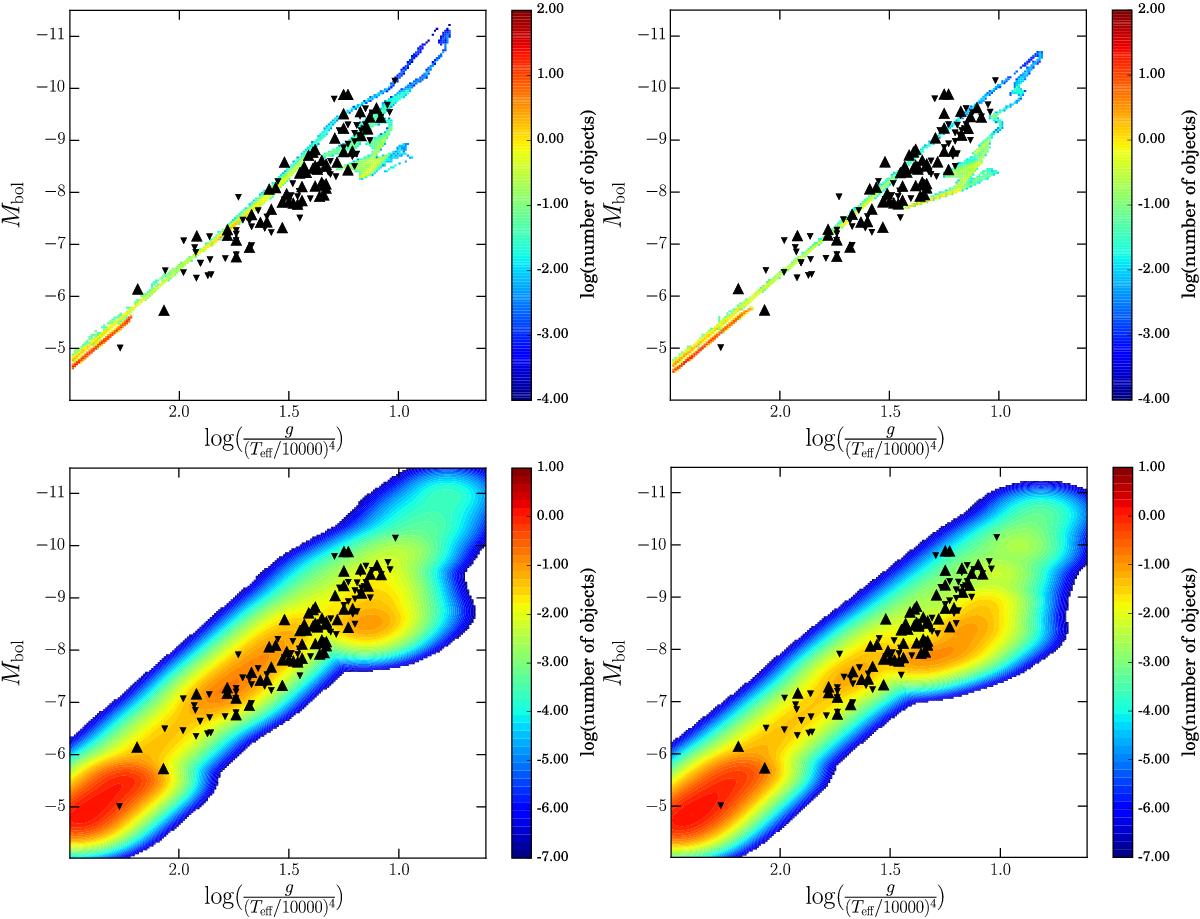
Population synthesis of blue supergiants in the FGLR-plane compared with the observations. The color-coded areas indicate the expected relative numbers of BSG. Triangles pointed up are “high-metallicity” (more than half solar) observed blue supergiants, and triangles down are “low metallicity” (less than half solar) ones. The triangles corresponding to the metallicity of the plot are larger. In the present plot, for example, the triangles up are bigger. Left upper panel: non-rotating models at Z = 0.014 calculated with standard mass-loss rates. Right upper panel: same as the upper left panel but for models that include stellar rotation. Lower left panel: same as the upper left panel but including the effects of observational uncertainties. Lower right panel: same as the upper right panel but including the effects of observational uncertainties.
Current usage metrics show cumulative count of Article Views (full-text article views including HTML views, PDF and ePub downloads, according to the available data) and Abstracts Views on Vision4Press platform.
Data correspond to usage on the plateform after 2015. The current usage metrics is available 48-96 hours after online publication and is updated daily on week days.
Initial download of the metrics may take a while.