Fig. 7
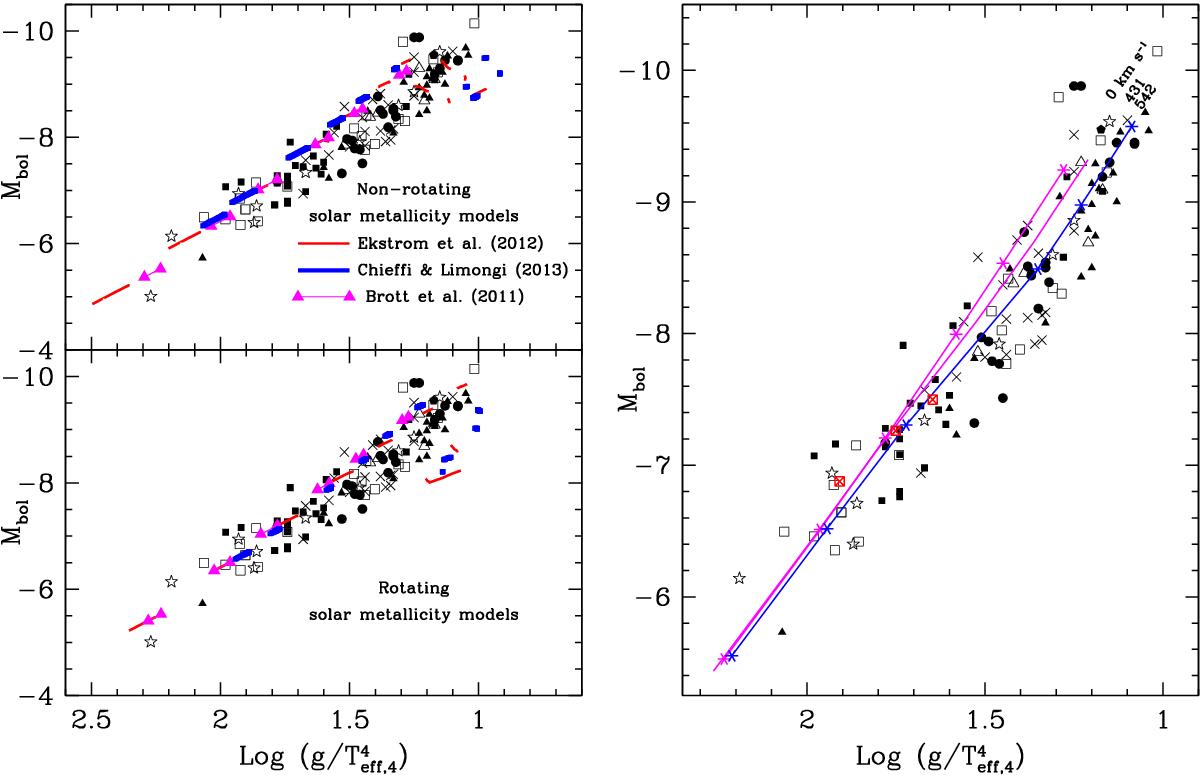
Left panel: comparisons between the positions of blue supergiants obtained in various grids of stellar models in the (![]() , Mbol)-plane (see text). The stellar grids are those from Ekström et al. (2012), Chieffi & Limongi (2013), and Brott et al. (2011). Initial masses for the Ekström et al. (2012) are 9, 12, 15, 20, 25, 32, and 40 M⊙. For the models by Chieffi & Limongi (2013), the masses are 13, 15, 20, 30, and 40 M⊙ and for the Brott et al. (2011) models 9, 12, 15, 20, 25, and 35 M⊙. The observations are overplotted as in the previous figures. The upper left panel shows evolution models without rotation, and the models in the lower left panel include the effects of rotation. The rotating models have initial velocities between 216 and 314 km s-1 (see text for more details). Right panel: comparison of the effects of initial rotational velocity for Group-1 BSG using the models by Brott et al. (2011). The upper (magenta) line labeled as 0 km s-1 connects the location in the FGLR-plane predicted by non-rotating stellar models when they enter the BSG domain in the HRD at the hottest effective temperature entry point. The middle (magenta) line labeled 431 connects the exit points at the coolest effective temperature as Group-1 BSG as predicted by rotating stellar models with initial velocities between 431 and 475 km s-1. The lowest (blue) line labeled 542 is similar to the middle magenta line but for rotating stellar models with initial velocities between 542 and 574 km s-1 (see text). The asterisks along the upper and lower curves indicate the positions of the 9, 12, 15, 20, 25, and 35 M⊙ stellar models. Added to this plot as red heavy crossed squares, the positions at the same evolutionary stages of 15 M⊙ stellar models with initial velocities equal to 0, 241, and 525 km s-1 (from bottom left to upper right) as computed by Georgy et al. (2013b) with similar physics to Ekström et al. (2012).
, Mbol)-plane (see text). The stellar grids are those from Ekström et al. (2012), Chieffi & Limongi (2013), and Brott et al. (2011). Initial masses for the Ekström et al. (2012) are 9, 12, 15, 20, 25, 32, and 40 M⊙. For the models by Chieffi & Limongi (2013), the masses are 13, 15, 20, 30, and 40 M⊙ and for the Brott et al. (2011) models 9, 12, 15, 20, 25, and 35 M⊙. The observations are overplotted as in the previous figures. The upper left panel shows evolution models without rotation, and the models in the lower left panel include the effects of rotation. The rotating models have initial velocities between 216 and 314 km s-1 (see text for more details). Right panel: comparison of the effects of initial rotational velocity for Group-1 BSG using the models by Brott et al. (2011). The upper (magenta) line labeled as 0 km s-1 connects the location in the FGLR-plane predicted by non-rotating stellar models when they enter the BSG domain in the HRD at the hottest effective temperature entry point. The middle (magenta) line labeled 431 connects the exit points at the coolest effective temperature as Group-1 BSG as predicted by rotating stellar models with initial velocities between 431 and 475 km s-1. The lowest (blue) line labeled 542 is similar to the middle magenta line but for rotating stellar models with initial velocities between 542 and 574 km s-1 (see text). The asterisks along the upper and lower curves indicate the positions of the 9, 12, 15, 20, 25, and 35 M⊙ stellar models. Added to this plot as red heavy crossed squares, the positions at the same evolutionary stages of 15 M⊙ stellar models with initial velocities equal to 0, 241, and 525 km s-1 (from bottom left to upper right) as computed by Georgy et al. (2013b) with similar physics to Ekström et al. (2012).
Current usage metrics show cumulative count of Article Views (full-text article views including HTML views, PDF and ePub downloads, according to the available data) and Abstracts Views on Vision4Press platform.
Data correspond to usage on the plateform after 2015. The current usage metrics is available 48-96 hours after online publication and is updated daily on week days.
Initial download of the metrics may take a while.