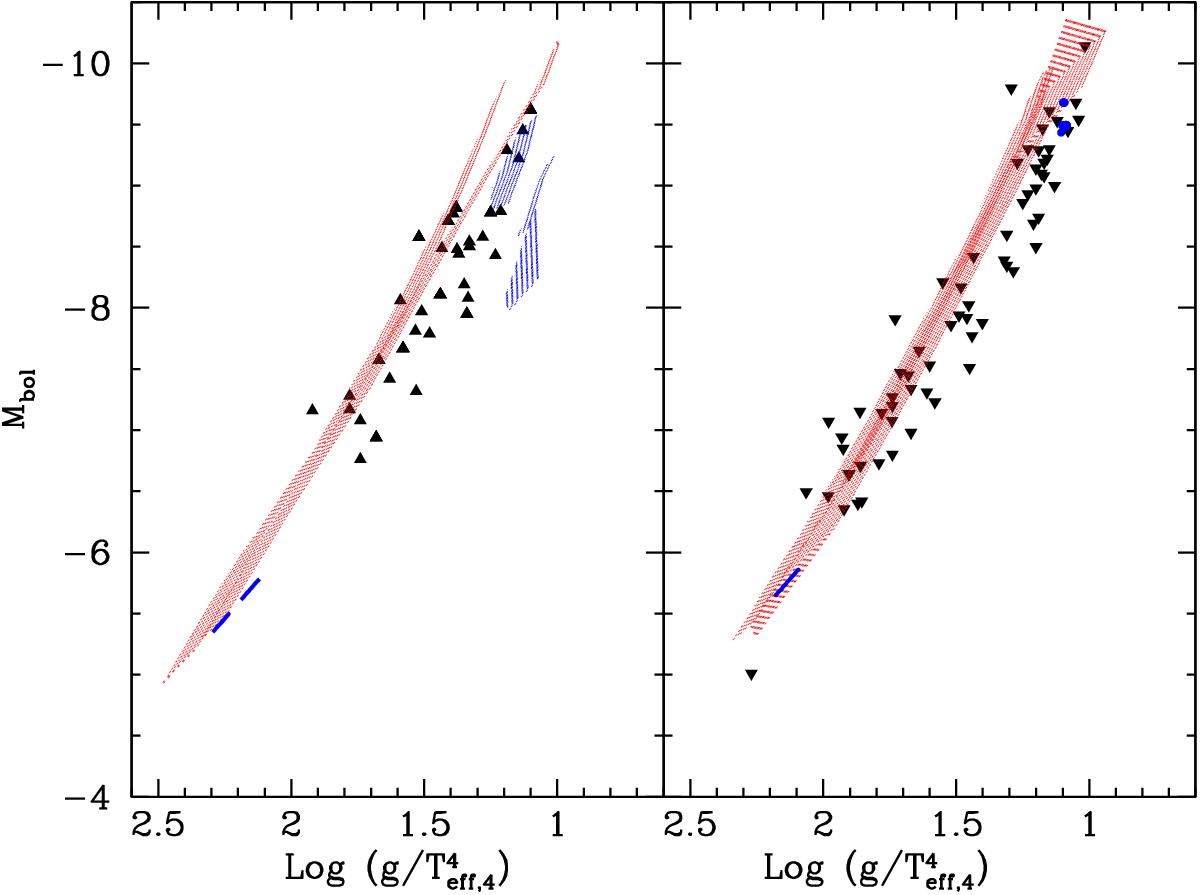
Fig. 6

Distributions of observed blue supergiants in the Mbol versus ![]() plane (triangles, see references in Fig. 2). The shaded zones indicate where the blue supergiants are predicted according to the stellar models. Left panel: the observations correspond to stars with a metallicity equal to or larger than about half solar, and the shaded areas show the predictions for the Z = 0.014 stellar models (rotating and non-rotating with standard mass-loss rates). Right panel: the observations correspond to stars with a metallicity lower than about half solar, and the shaded areas show the predictions for the rotating and non-rotating Z = 0.002 stellar models with standard mass-loss rates. The blue dots show the very restricted zone where Group-2 BSGs lie in this diagram, see lower panels of Fig. 5.
plane (triangles, see references in Fig. 2). The shaded zones indicate where the blue supergiants are predicted according to the stellar models. Left panel: the observations correspond to stars with a metallicity equal to or larger than about half solar, and the shaded areas show the predictions for the Z = 0.014 stellar models (rotating and non-rotating with standard mass-loss rates). Right panel: the observations correspond to stars with a metallicity lower than about half solar, and the shaded areas show the predictions for the rotating and non-rotating Z = 0.002 stellar models with standard mass-loss rates. The blue dots show the very restricted zone where Group-2 BSGs lie in this diagram, see lower panels of Fig. 5.
Current usage metrics show cumulative count of Article Views (full-text article views including HTML views, PDF and ePub downloads, according to the available data) and Abstracts Views on Vision4Press platform.
Data correspond to usage on the plateform after 2015. The current usage metrics is available 48-96 hours after online publication and is updated daily on week days.
Initial download of the metrics may take a while.


