Fig. 2
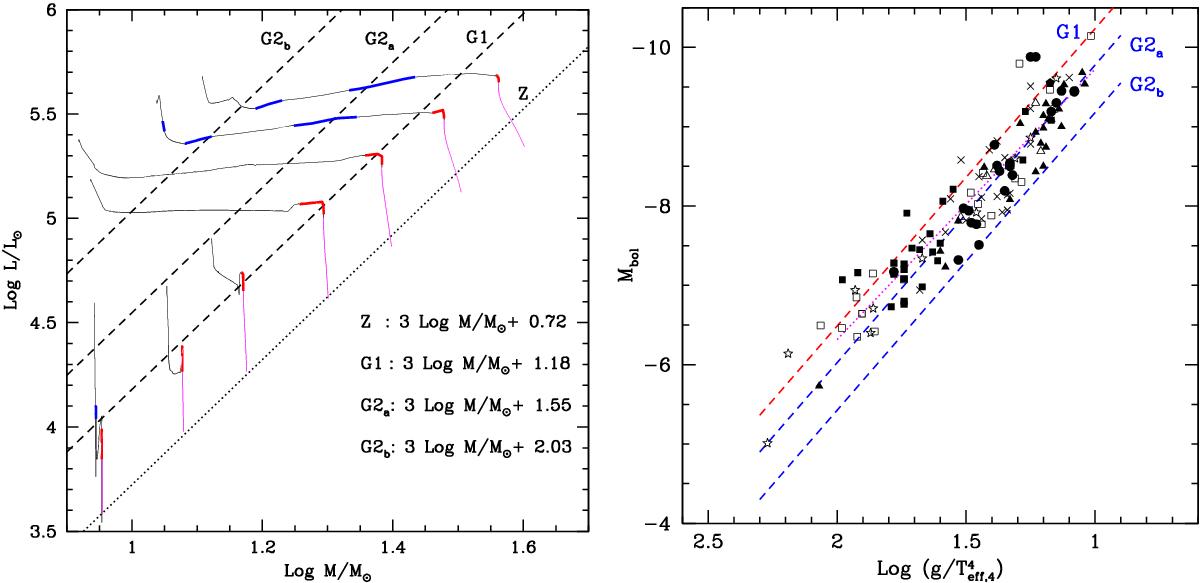
Left panel: evolutionary tracks at solar metallicity without rotation in the (log M/M⊙, log L/L⊙)-plane. M is the actual mass of the star during the evolution. The dashed lines are mass-luminosity relations with α = 3 and b = 0.72316, 1.17955, 1.54727, and 2.03346 (bottom-up). The lower vertical or nearly vertical (magenta) part of the track corresponds to the main-sequence phase, while the red and blue parts show the Groups 1 and 2 phases before and after the RSG stage. Right panel: flux-weighted gravity-luminosity relations obtained from Eq. (0) and the mass-luminosity relations labeled G1, G2a, and G2b in the left panel. The points represent observations of individual BSG. The black squares are the values for NGC 300 given by Kudritzki et al. (2008b). The full triangles are for supergiants in other galaxies studied by Kudritzki et al. (2008a). Full circles and crosses are BSGs in M 33 (U et al. 2009) and M 81 (Kudritzki et al. 2012), respectively. The empty stars and empty squares show the data for the metal-poor Local Group galaxies WLM (Urbaneja et al. 2008) and NGC 3109 by (Hosek et al. 2014). The empty triangles and the full pentagons correspond to BSG in NGC 3621 (Kudritzki et al. 2014) and in NGC 4258 (Kudritzki et al. 2013), respectively. The dotted magenta line represents the FGLR calibration obtained by Kudritzki et al. (2008b).
Current usage metrics show cumulative count of Article Views (full-text article views including HTML views, PDF and ePub downloads, according to the available data) and Abstracts Views on Vision4Press platform.
Data correspond to usage on the plateform after 2015. The current usage metrics is available 48-96 hours after online publication and is updated daily on week days.
Initial download of the metrics may take a while.