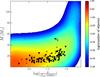
Fig. 11
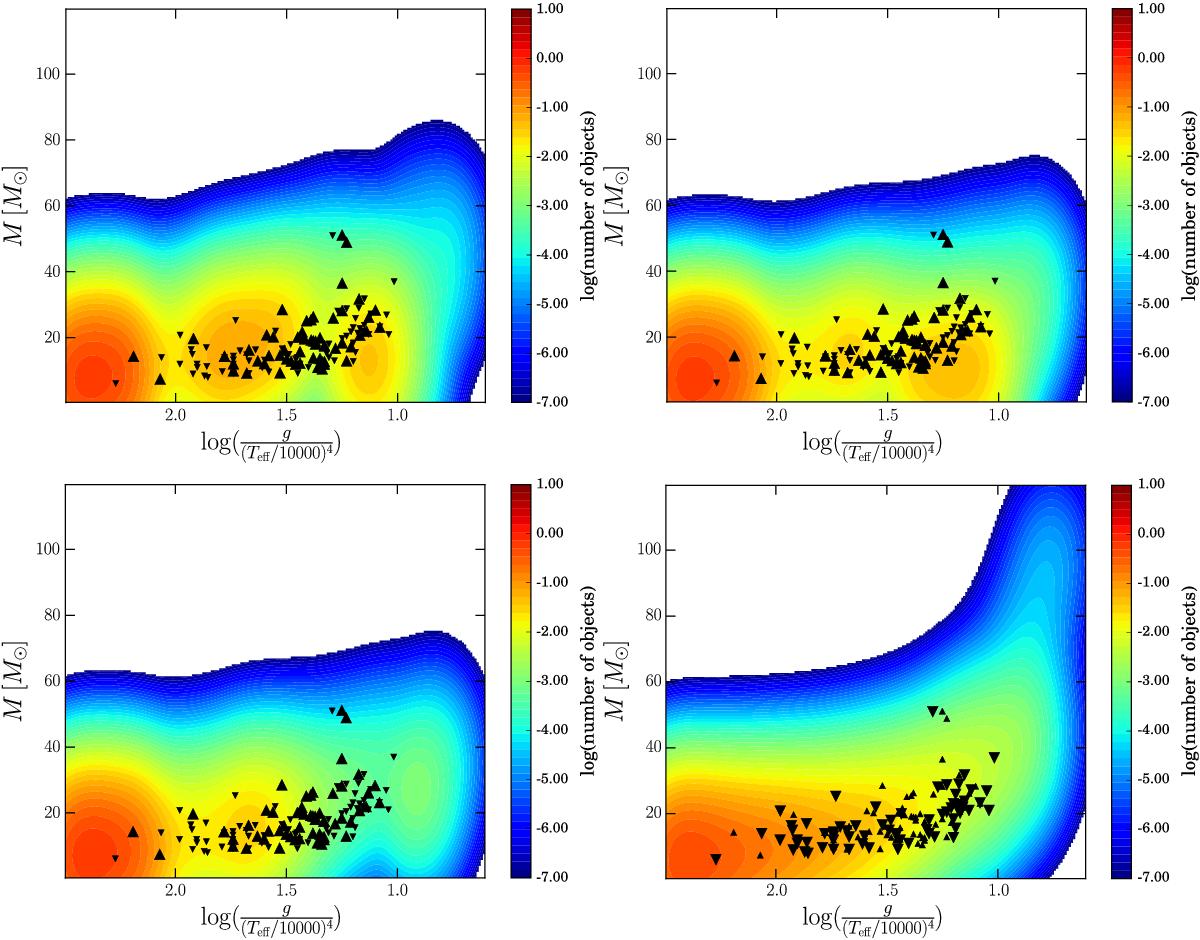
Predicted density plots of evolutionary masses compared with observed BSG spectroscopic masses. Upper left panel: tracks without rotation at Z = 0.014. Upper right panel: tracks with rotation at Z = 0.014. Lower left panel: tracks with rotation at Z = 0.014 without Group 2 BSG. Lower right panel: tracks with rotation at Z = 0.002.
Current usage metrics show cumulative count of Article Views (full-text article views including HTML views, PDF and ePub downloads, according to the available data) and Abstracts Views on Vision4Press platform.
Data correspond to usage on the plateform after 2015. The current usage metrics is available 48-96 hours after online publication and is updated daily on week days.
Initial download of the metrics may take a while.