Fig. 1
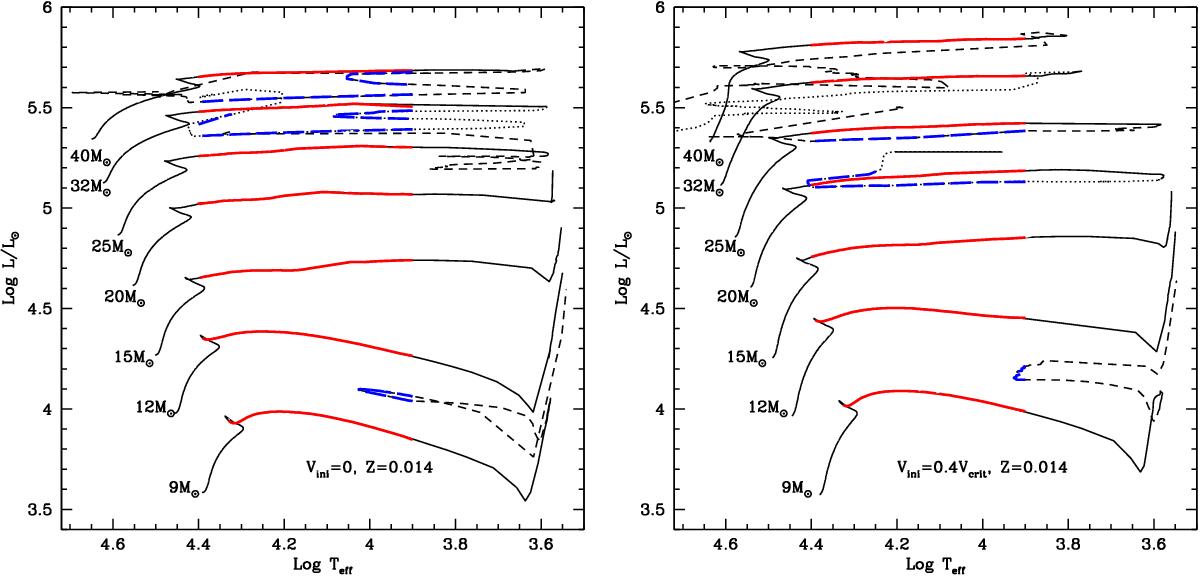
Evolutionary tracks in the Herstzsprung-Russel diagram calculated for solar metallicity Z = 0.014 for initial masses 9, 12, 15, 20, 25, 32, and 40 M⊙. The continuous lines show the track until the red supergiant phase. After the red supergiant stage, either dashed or dotted lines are used. The BSG phase is highlighted in red for the evolution toward the RSG phase (Group 1, see text) and in blue (dashed) for the evolution back after the RSG stage (Group 2). The models are from Ekström et al. (2012). Left panel: models without the effects of stellar rotation. Right panel: models including rotation (see text).
Current usage metrics show cumulative count of Article Views (full-text article views including HTML views, PDF and ePub downloads, according to the available data) and Abstracts Views on Vision4Press platform.
Data correspond to usage on the plateform after 2015. The current usage metrics is available 48-96 hours after online publication and is updated daily on week days.
Initial download of the metrics may take a while.