Free Access
Fig. 7
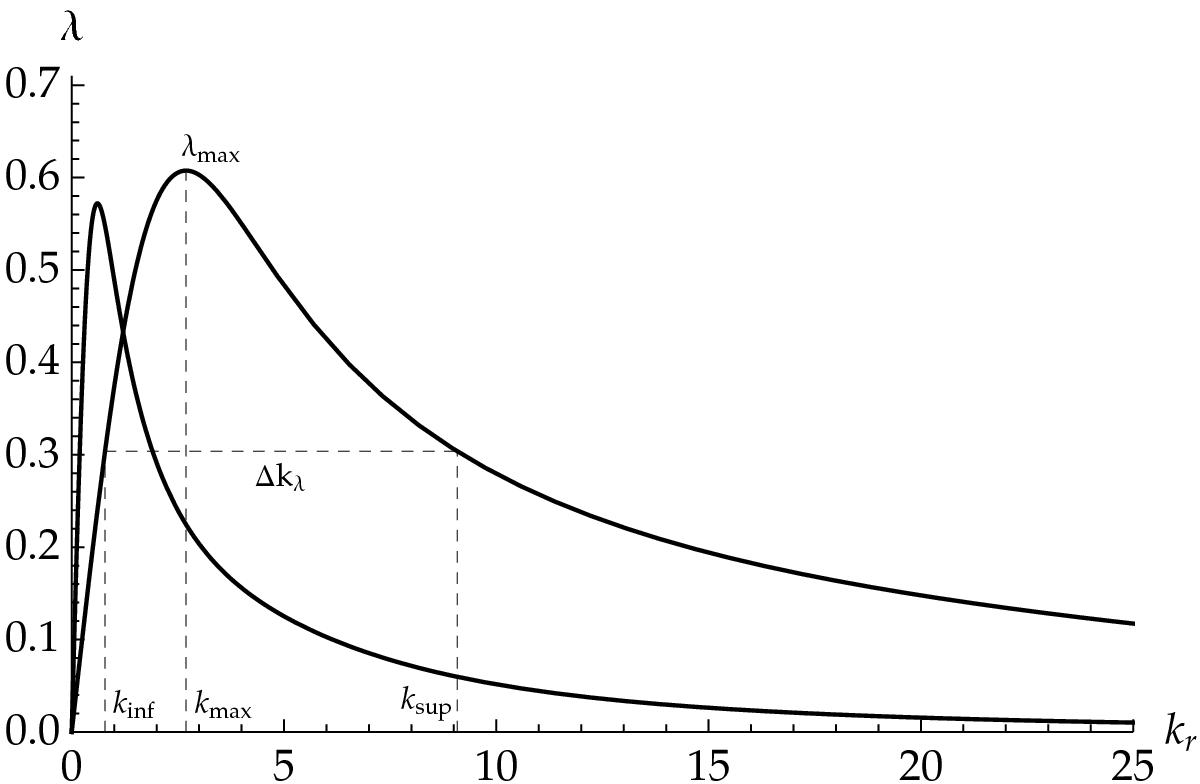
Variations of the response matrix eigenvalues λ with the WKB-frequency kr, for m = mCOR and two values of Jφ. The curve that peaks at large kr is for the smaller value of Jφ.
Current usage metrics show cumulative count of Article Views (full-text article views including HTML views, PDF and ePub downloads, according to the available data) and Abstracts Views on Vision4Press platform.
Data correspond to usage on the plateform after 2015. The current usage metrics is available 48-96 hours after online publication and is updated daily on week days.
Initial download of the metrics may take a while.