Free Access
Fig. E.1
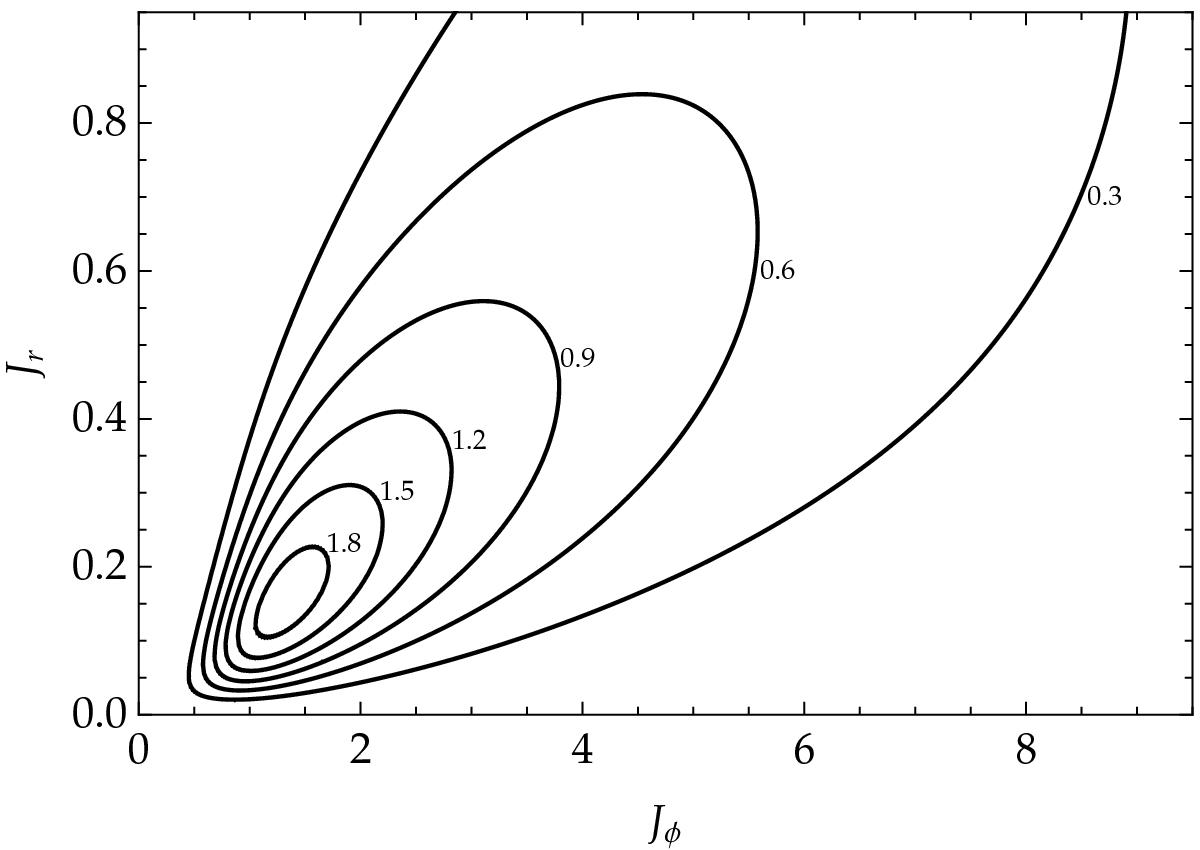
Contours in action-space (Jφ,Jr) of the difference between the sampled anisotropic DF of S12 simulation ![]() and its Schwarzschild epicyclic approximation FSch from Eq. (25). The plotted quantity is
and its Schwarzschild epicyclic approximation FSch from Eq. (25). The plotted quantity is ![]() , and contours labels are expressed in percentages.
, and contours labels are expressed in percentages.
Current usage metrics show cumulative count of Article Views (full-text article views including HTML views, PDF and ePub downloads, according to the available data) and Abstracts Views on Vision4Press platform.
Data correspond to usage on the plateform after 2015. The current usage metrics is available 48-96 hours after online publication and is updated daily on week days.
Initial download of the metrics may take a while.