Fig. 11
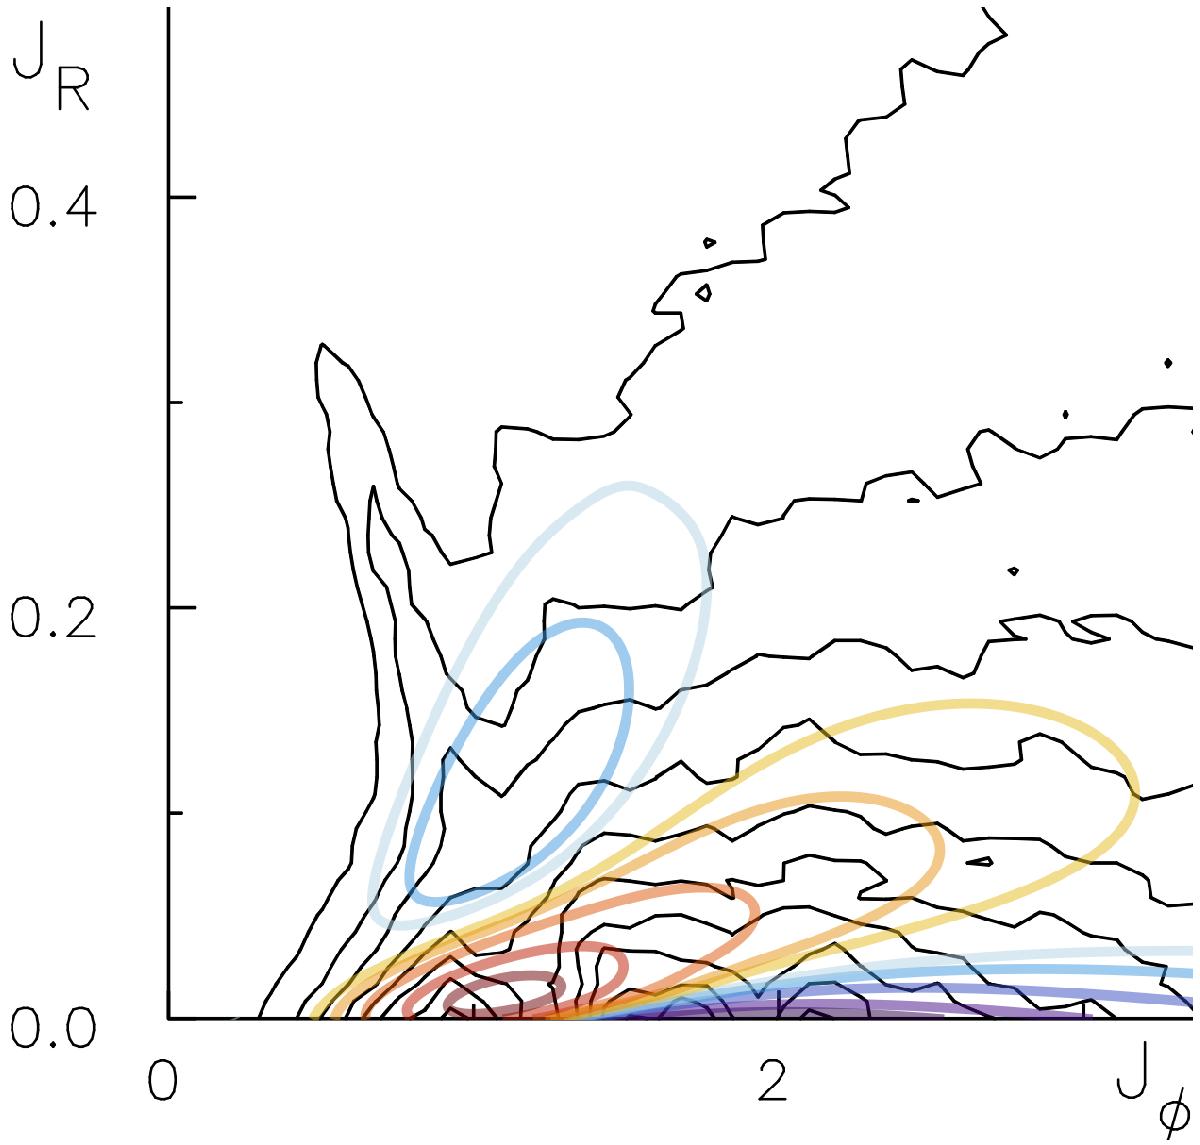
Overlay of the WKB predictions for the divergence of the diffusion flux N div(ℱtot) on top of the contours of the DF in action-space measured in the S12 simulation. The black background contours are the levels contours of the DF at time tS12 = 1400 (see the lower panel of Fig. 7 of S12). These contours are spaced linearly between 95% and 5% of the DF maximum and exhibit clearly the appearance of a resonant ridge. The coloured transparent contours correspond to the predicted values of N div(ℱtot) using the same conventions as in Fig. 9. We note that the developed late time ridge is consistent with the predicted depletion (red) and enrichment (blue) of orbits.
Current usage metrics show cumulative count of Article Views (full-text article views including HTML views, PDF and ePub downloads, according to the available data) and Abstracts Views on Vision4Press platform.
Data correspond to usage on the plateform after 2015. The current usage metrics is available 48-96 hours after online publication and is updated daily on week days.
Initial download of the metrics may take a while.