Fig. 9
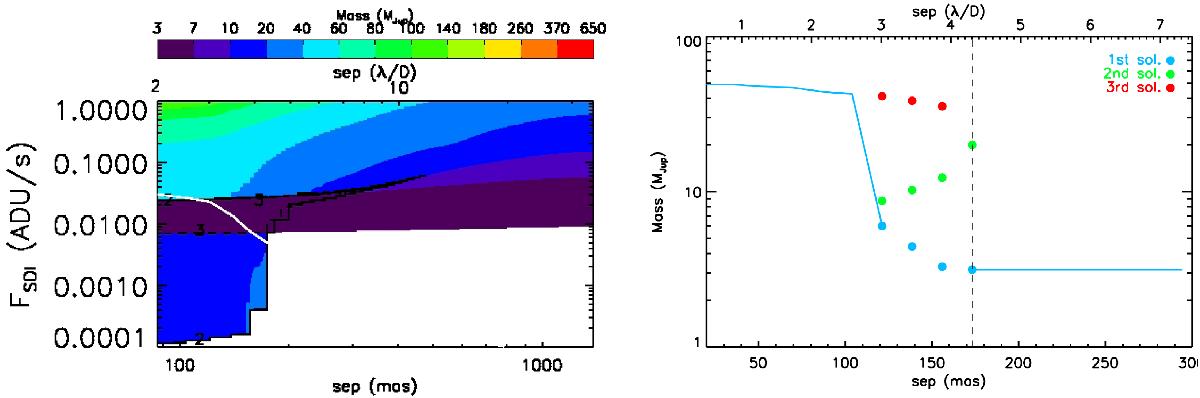
Left panel: same as the bottom right panel of Fig. 8, but with the noise level artificially improved by a hundred to come across the degenerated region. Right panel: corresponding SDI sensitivity limit that gives the minimum detectable map. In between the vertical dashed lines, the noise-to-mass function is degenerated with three possible solutions, plotted with the circles.
Current usage metrics show cumulative count of Article Views (full-text article views including HTML views, PDF and ePub downloads, according to the available data) and Abstracts Views on Vision4Press platform.
Data correspond to usage on the plateform after 2015. The current usage metrics is available 48-96 hours after online publication and is updated daily on week days.
Initial download of the metrics may take a while.