Fig. 8
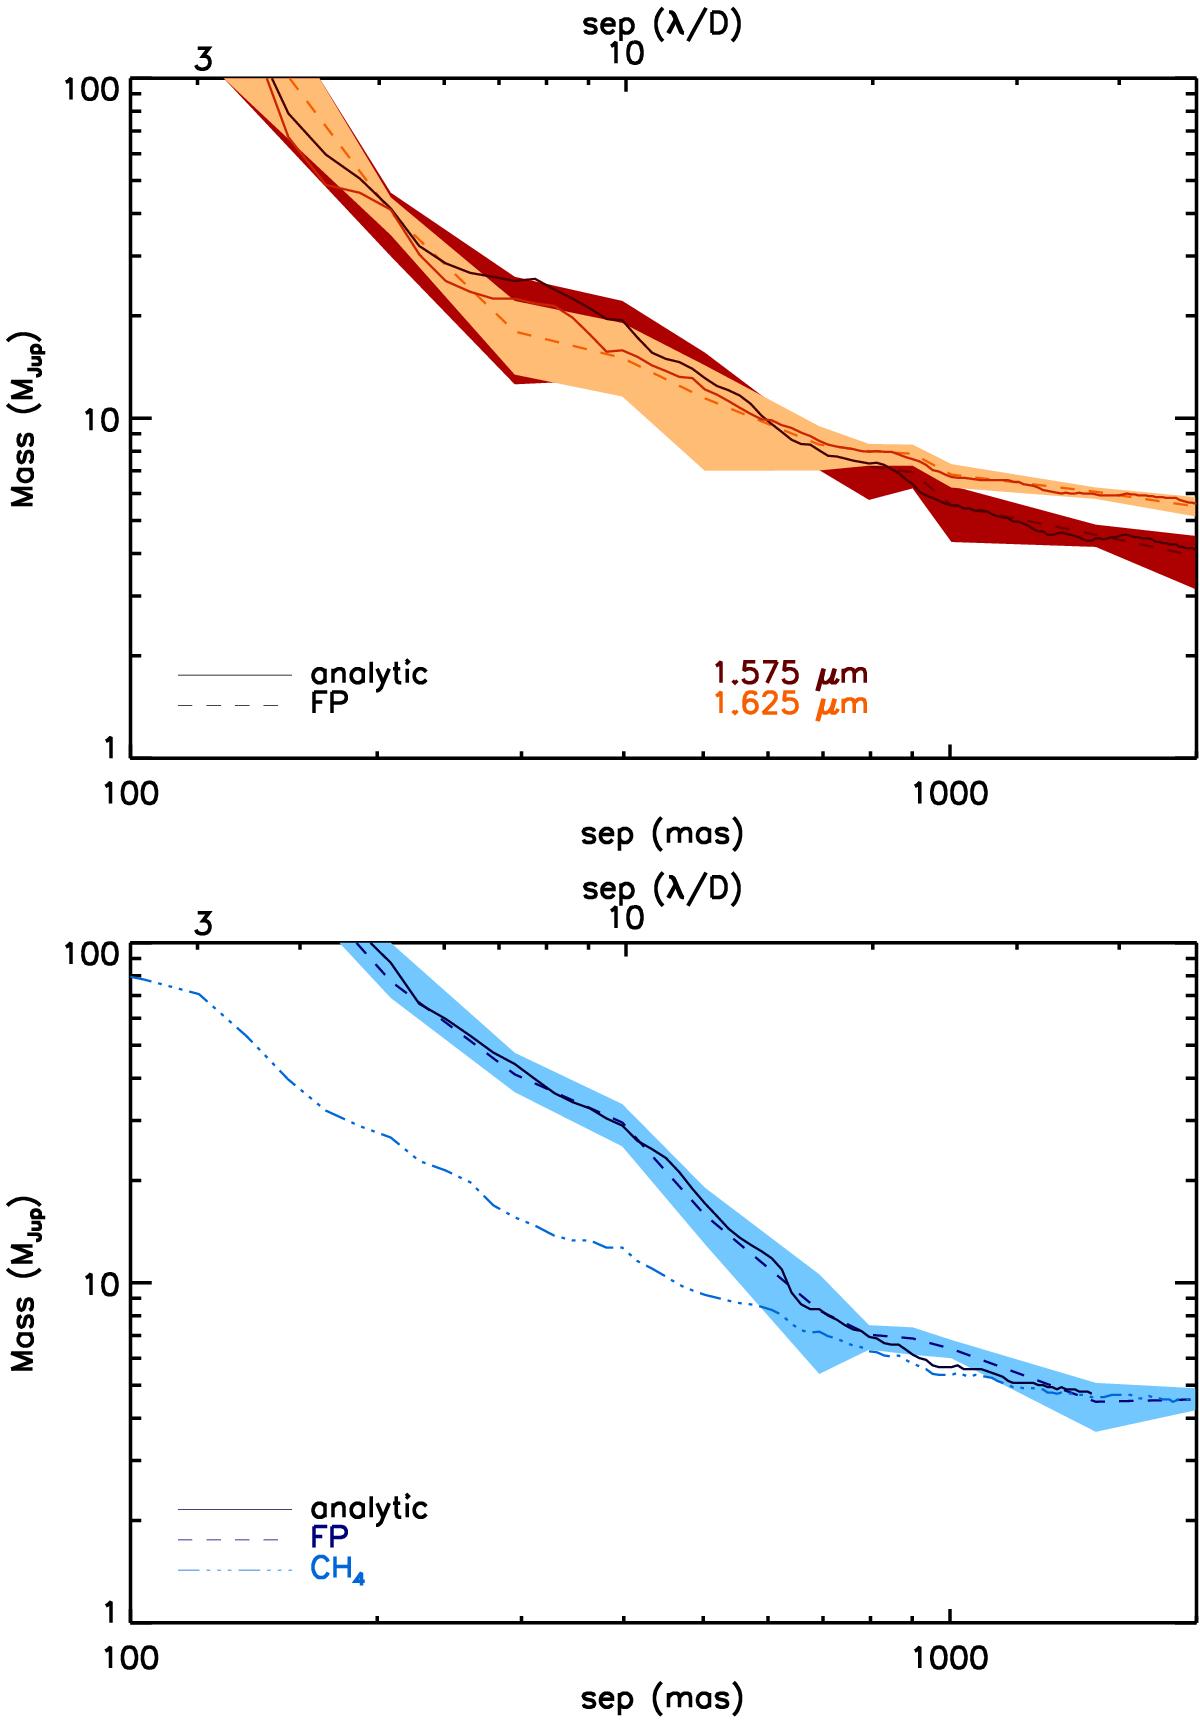
Detection limits on AB Dor at 1.575 μm (orange), 1.625 μm (red) in the top panel and in SDI (blue) in the bottom panel as a function of the separation. The solid lines (analytic) were estimated from a direct conversion of five times the noise into mass with the conversion map for SDI or with standard contrast conversion for single-band images. The limits were also estimated by injecting FP according to the predictions of the model, processed independently, until S/N = 5 was reached (“FP”, dashed lines), with a 1σ dispersion over five position angles (shaded area). The direct conversion from noise to contrast and mass without taking the SDI photometric bias into account, i.e., assuming a T8 SpT, is overplotted (“CH4”, triple-dotted dashed line).
Current usage metrics show cumulative count of Article Views (full-text article views including HTML views, PDF and ePub downloads, according to the available data) and Abstracts Views on Vision4Press platform.
Data correspond to usage on the plateform after 2015. The current usage metrics is available 48-96 hours after online publication and is updated daily on week days.
Initial download of the metrics may take a while.