Fig. 6
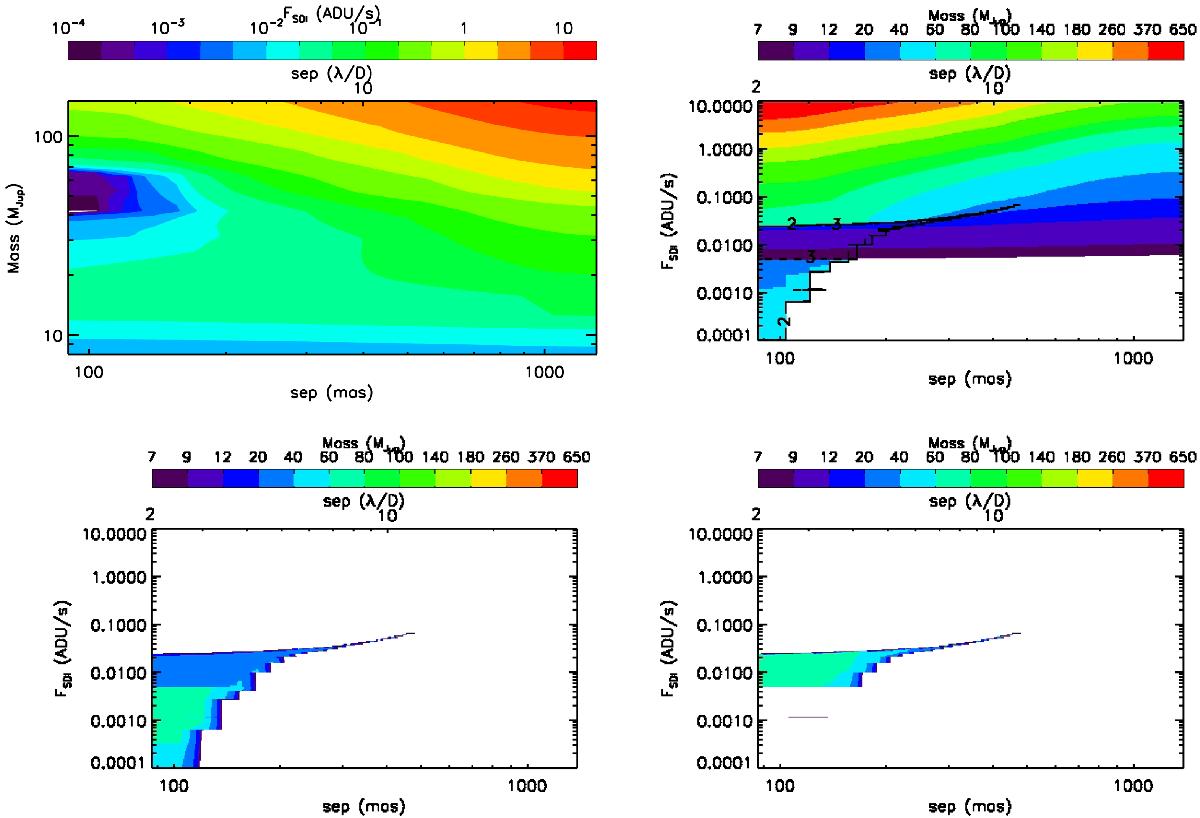
Top left panel: flux measured on the SDI residual maximum as a function of the mass and separation, assuming an age of 500 Myr, a distance of 15 pc, and H = 4.84 mag. Contours indicate FSDI in (ADU/s). White areas correspond to negative flux. Top right panel: mass map as a function of the separation and predicted FSDI. Regions where a degeneracy appears are specified with black contours, indicating the number of solutions. The first (and less massive) solution is plotted here. Cases without solution are plotted in white. Bottom left panel: the same, but considering the second solution in mass. Bottom right panel: the same, but considering the third solution in mass (see text).
Current usage metrics show cumulative count of Article Views (full-text article views including HTML views, PDF and ePub downloads, according to the available data) and Abstracts Views on Vision4Press platform.
Data correspond to usage on the plateform after 2015. The current usage metrics is available 48-96 hours after online publication and is updated daily on week days.
Initial download of the metrics may take a while.