Fig. 5
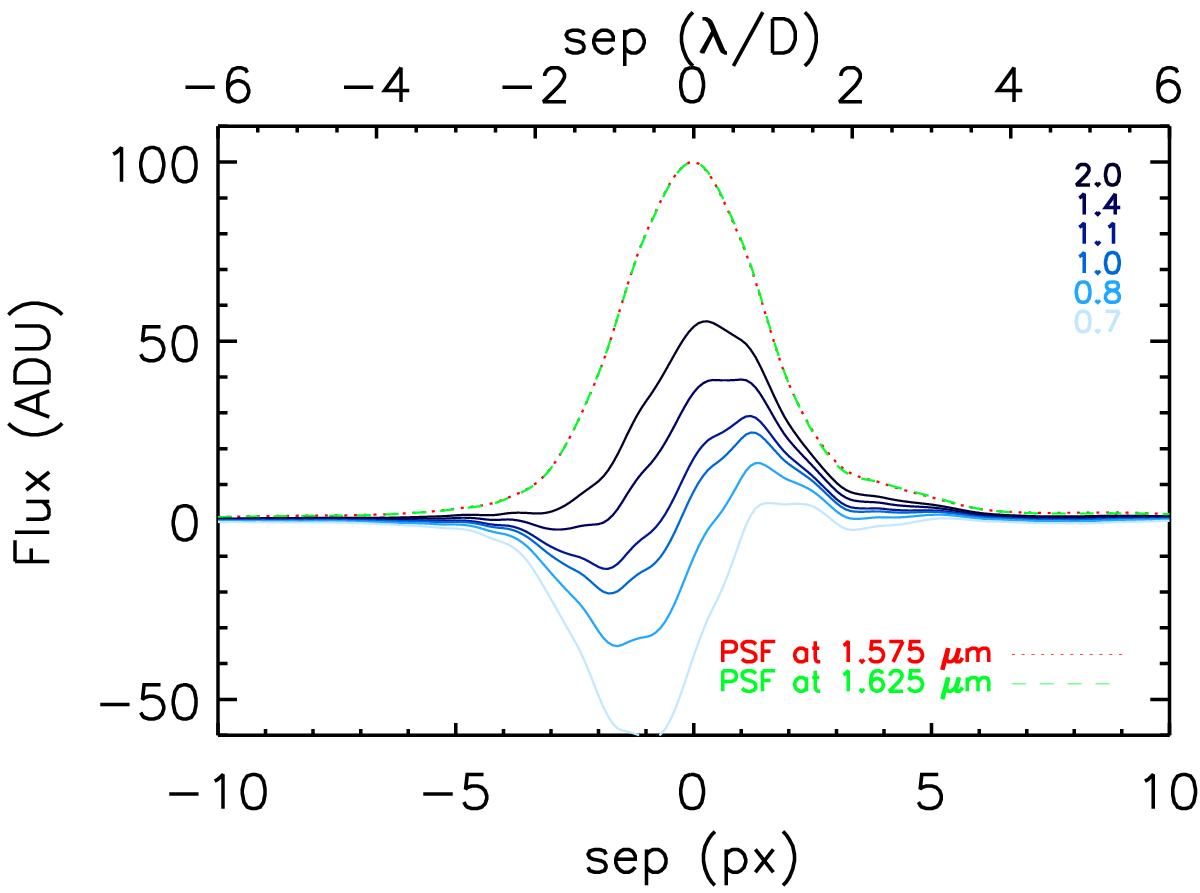
Radial profiles of residual SDI patterns along the shift direction, separated by 6λ/D (300 mas) from the center of the image. PSF profiles are overplotted (dashed and dotted lines). The legend value indicates F1/F3 (and corresponds to F3/F1 = 0.5, 0.8, 0.9, 1.0, 1.2, and 1.5). All profiles have been centered on 0 for clarity.
Current usage metrics show cumulative count of Article Views (full-text article views including HTML views, PDF and ePub downloads, according to the available data) and Abstracts Views on Vision4Press platform.
Data correspond to usage on the plateform after 2015. The current usage metrics is available 48-96 hours after online publication and is updated daily on week days.
Initial download of the metrics may take a while.