Fig. 4
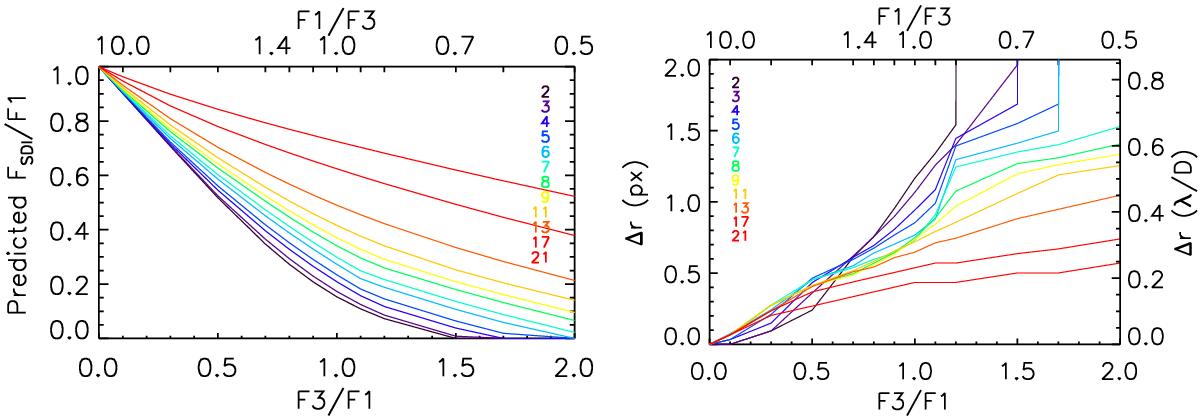
Left panel: flux measured on the peak of the residual and normalized to the injected F1 as a function of the flux ratio. The legend values indicate the separation in λ/D (equivalent to 87, 121, 173, 208, 259, 294, 346, 381, 433, 520, 690, and 866 mas). PSFs were reduced independently in noise-free images. Right panel: relative position between the peak in the residual pattern and the injected PSF. The 0.1 pixel in precision on the peak measurement leads to an unsmoothed curve.
Current usage metrics show cumulative count of Article Views (full-text article views including HTML views, PDF and ePub downloads, according to the available data) and Abstracts Views on Vision4Press platform.
Data correspond to usage on the plateform after 2015. The current usage metrics is available 48-96 hours after online publication and is updated daily on week days.
Initial download of the metrics may take a while.