Free Access
Fig. 9
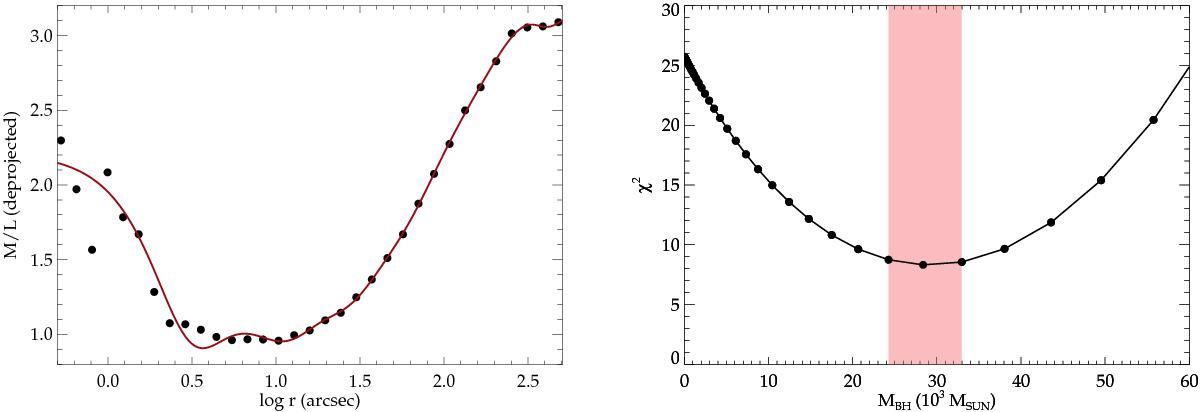
Input M/L profile obtained from N-body simulations (left) and χ2 for the different Jeans models from Fig. 8 (right) with a best-fit black-hole mass of M• = (2.4 ± 0.4) × 104 M⊙. While the rise in the M/L in the central region is due to stellar remnants, the rise at larger radii originates from low-mass stars.
Current usage metrics show cumulative count of Article Views (full-text article views including HTML views, PDF and ePub downloads, according to the available data) and Abstracts Views on Vision4Press platform.
Data correspond to usage on the plateform after 2015. The current usage metrics is available 48-96 hours after online publication and is updated daily on week days.
Initial download of the metrics may take a while.