Fig. 7
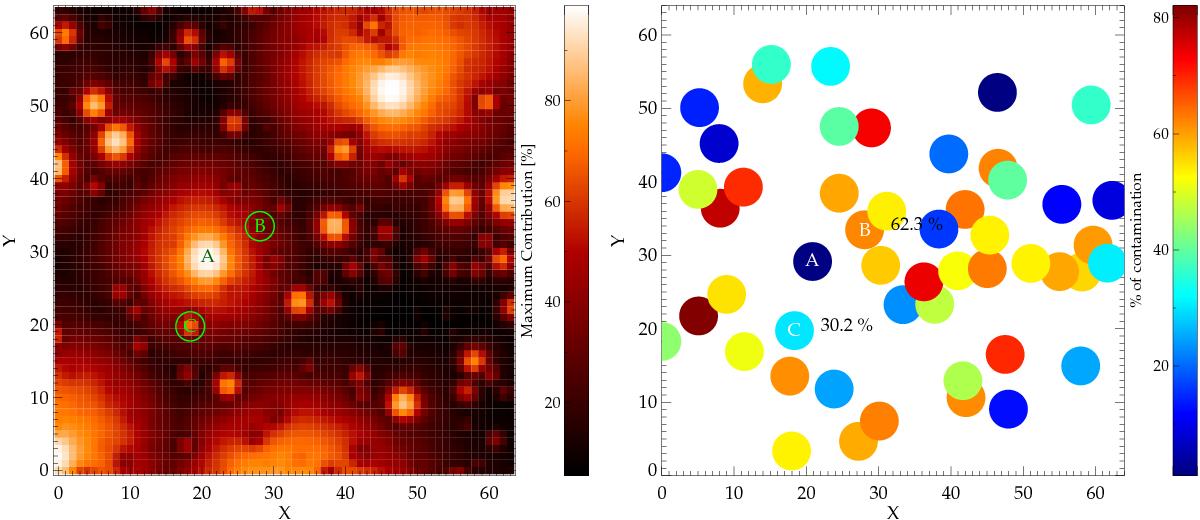
Contamination map for the SINFONI pointing. Left panel shows the maximum contribution of a single star to each spaxel. From this map the right panel is constructed, which shows for each star that is measured in the SINFONI pointing the percentage of contamination by other stars. All stars above the dark blue region are contaminated by more than 20%.
Current usage metrics show cumulative count of Article Views (full-text article views including HTML views, PDF and ePub downloads, according to the available data) and Abstracts Views on Vision4Press platform.
Data correspond to usage on the plateform after 2015. The current usage metrics is available 48-96 hours after online publication and is updated daily on week days.
Initial download of the metrics may take a while.