Free Access
Fig. 4
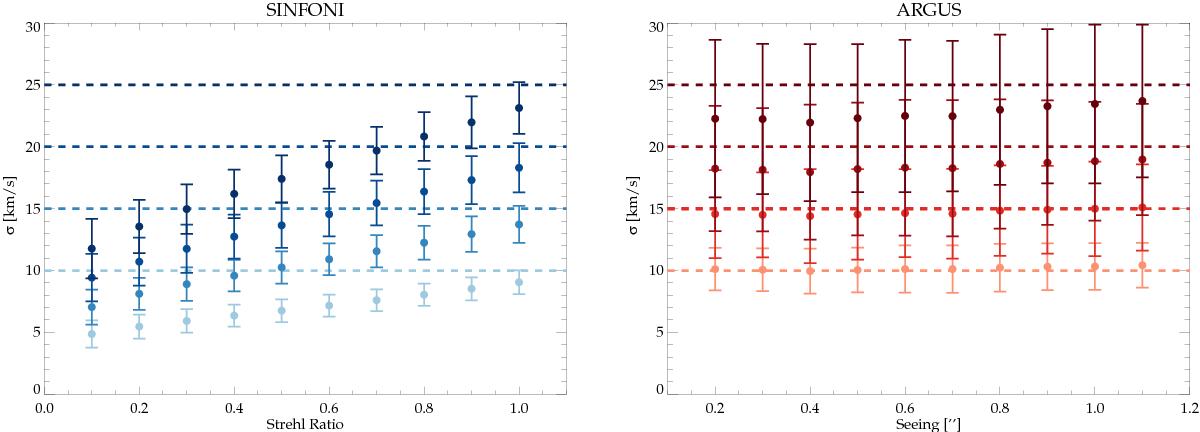
IFU simulations for SINFONI and ARGUS (central bin) with different input velocity dispersions as a function of Strehl ratio and seeing. The input velocity dispersions are shown as dashed lines, the measured velocity dispersions as dots in the corresponding color.
Current usage metrics show cumulative count of Article Views (full-text article views including HTML views, PDF and ePub downloads, according to the available data) and Abstracts Views on Vision4Press platform.
Data correspond to usage on the plateform after 2015. The current usage metrics is available 48-96 hours after online publication and is updated daily on week days.
Initial download of the metrics may take a while.