Fig. 2
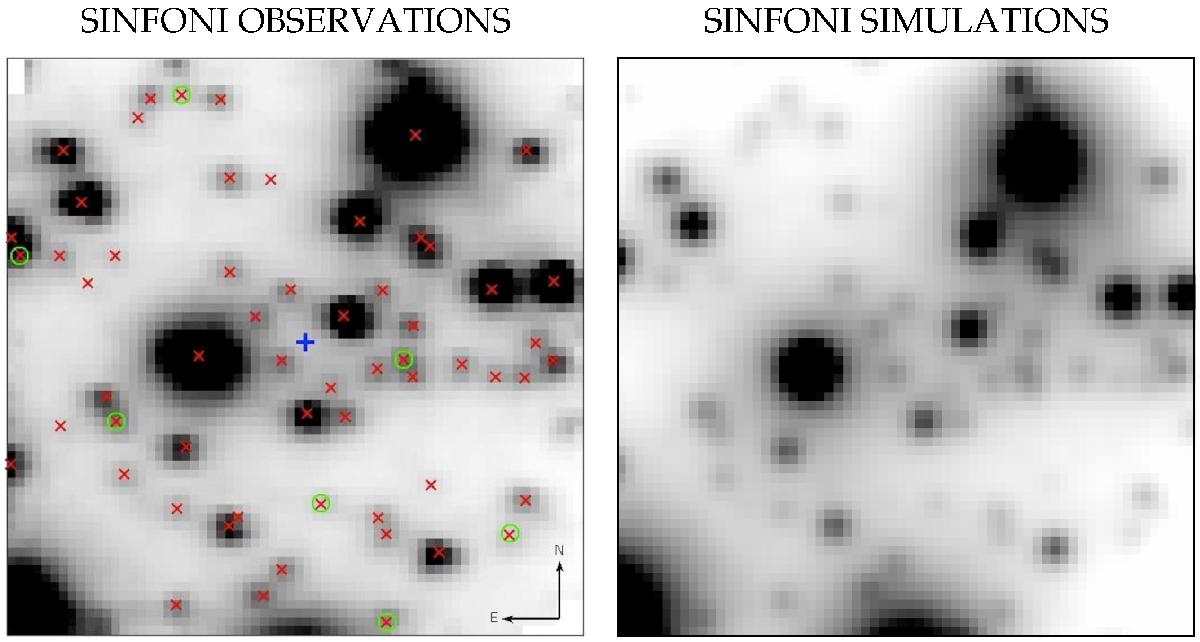
Observed (left) and simulated (right) 3.2′′ × 3.2′′ field of view of the SINFONI IFU. The Strehl ratio of the simulated data cube is chosen to be the same as the observed one, 30%. Red crosses in the left panel mark the stars that were detected in the SINFONI observations, while green circles depict the stars that were not used in the final analysis of Lanzoni et al. (2015) because of their low signal-to-noise ratio.
Current usage metrics show cumulative count of Article Views (full-text article views including HTML views, PDF and ePub downloads, according to the available data) and Abstracts Views on Vision4Press platform.
Data correspond to usage on the plateform after 2015. The current usage metrics is available 48-96 hours after online publication and is updated daily on week days.
Initial download of the metrics may take a while.