Free Access
Fig. 9
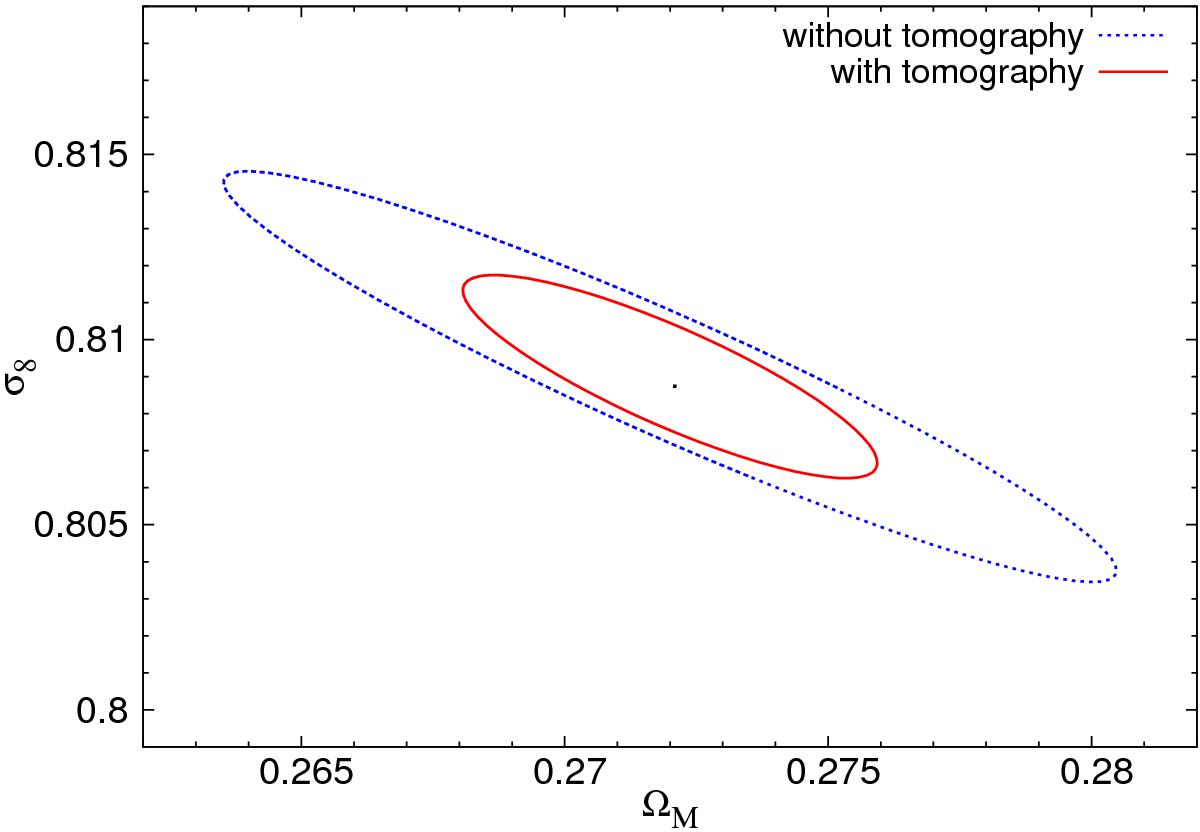
Fisher ellipses (at 1σ) for Ωm and σ8 for a Euclid-like survey. The blue dashed curve shows the joint conditional constraints without tomography, while the solid red contour gives those when using tomography with five redshift bins, demonstrating the important gain.
Current usage metrics show cumulative count of Article Views (full-text article views including HTML views, PDF and ePub downloads, according to the available data) and Abstracts Views on Vision4Press platform.
Data correspond to usage on the plateform after 2015. The current usage metrics is available 48-96 hours after online publication and is updated daily on week days.
Initial download of the metrics may take a while.