Fig. 7
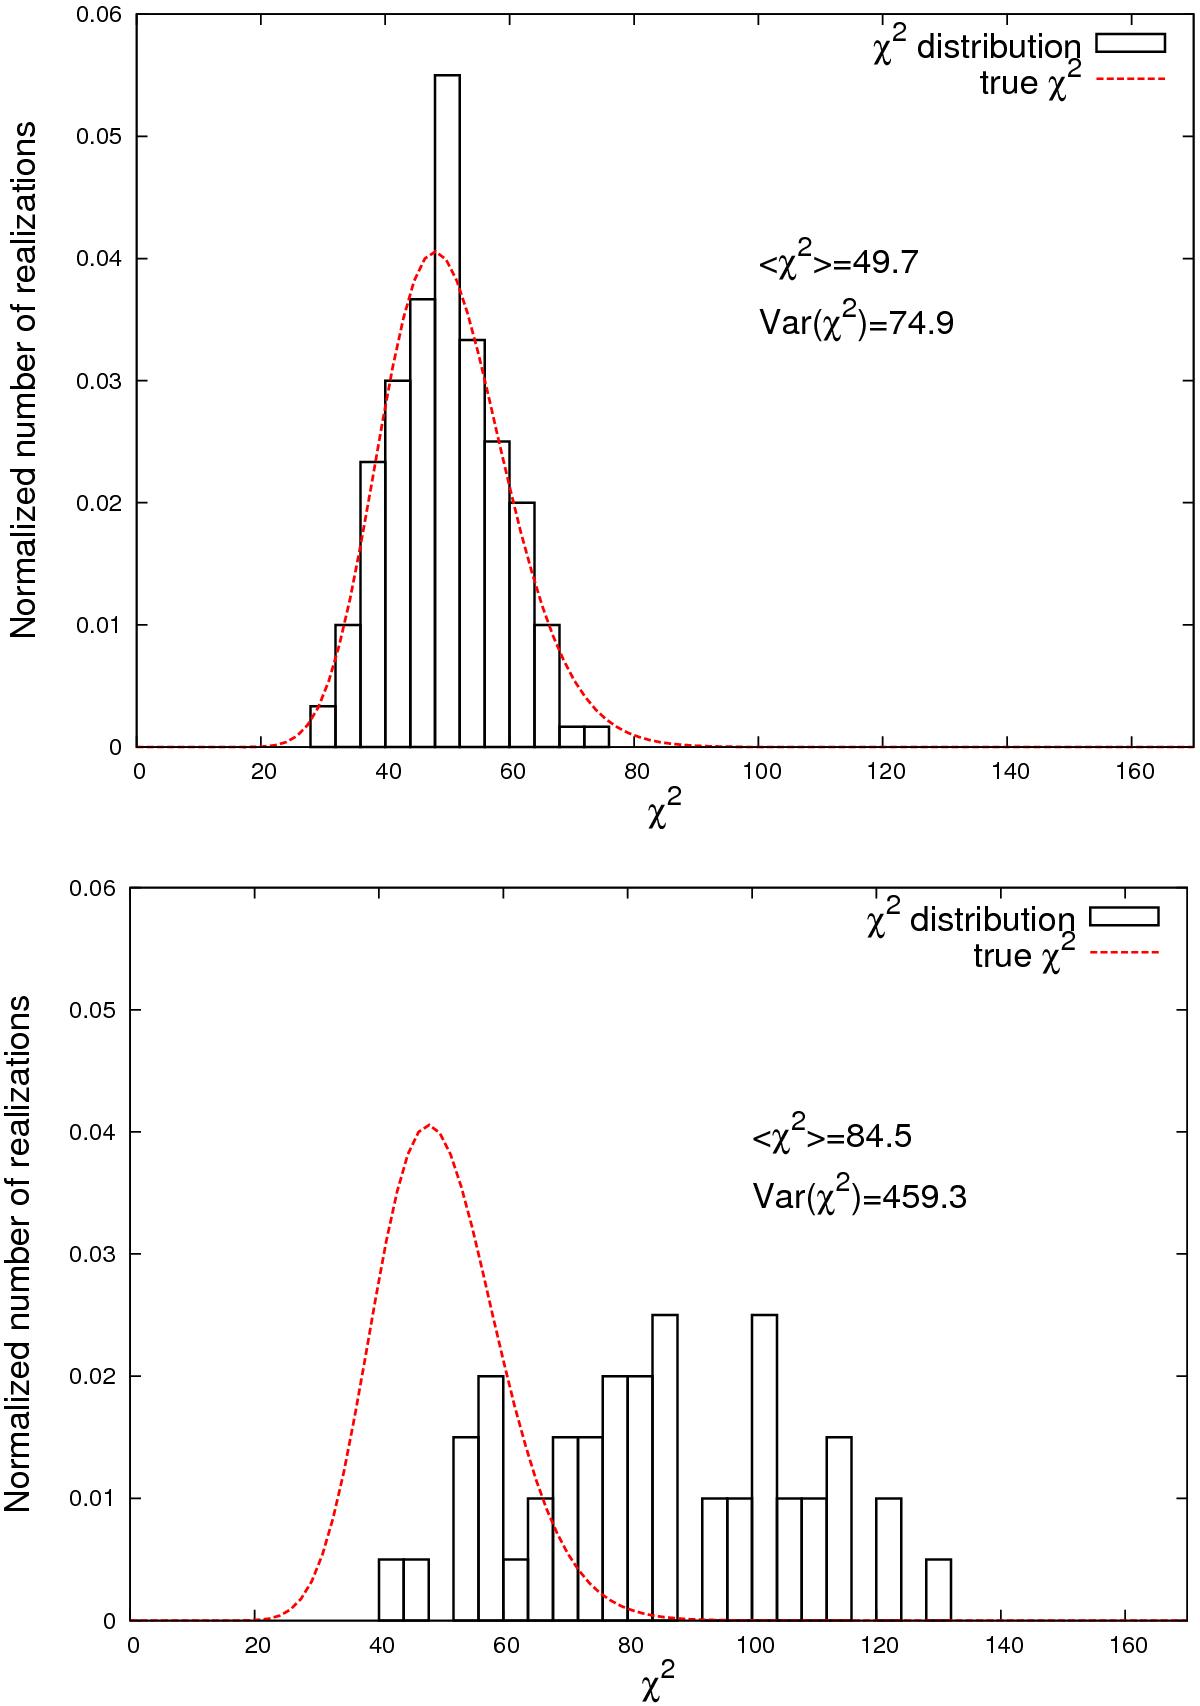
Normalized χ2 distributions with respect to the covariance matrix for 150 realizations of the fiducial cosmology with five source redshift planes. Each of the five source planes is associated with 10 signal-to-noise bins containing equal numbers of peaks. Black histograms trace the distribution observed in the simulations and the red curve represents a theoretical χ2 distribution with 50 degrees-of-freedom. The top panel gives the distribution for the 150 realizations of the fiducial model. The lower panel gives the distribution for the 50 realizations of the alternate cosmology with Ωm increased by 10% from its fiducial value.
Current usage metrics show cumulative count of Article Views (full-text article views including HTML views, PDF and ePub downloads, according to the available data) and Abstracts Views on Vision4Press platform.
Data correspond to usage on the plateform after 2015. The current usage metrics is available 48-96 hours after online publication and is updated daily on week days.
Initial download of the metrics may take a while.