Fig. 6
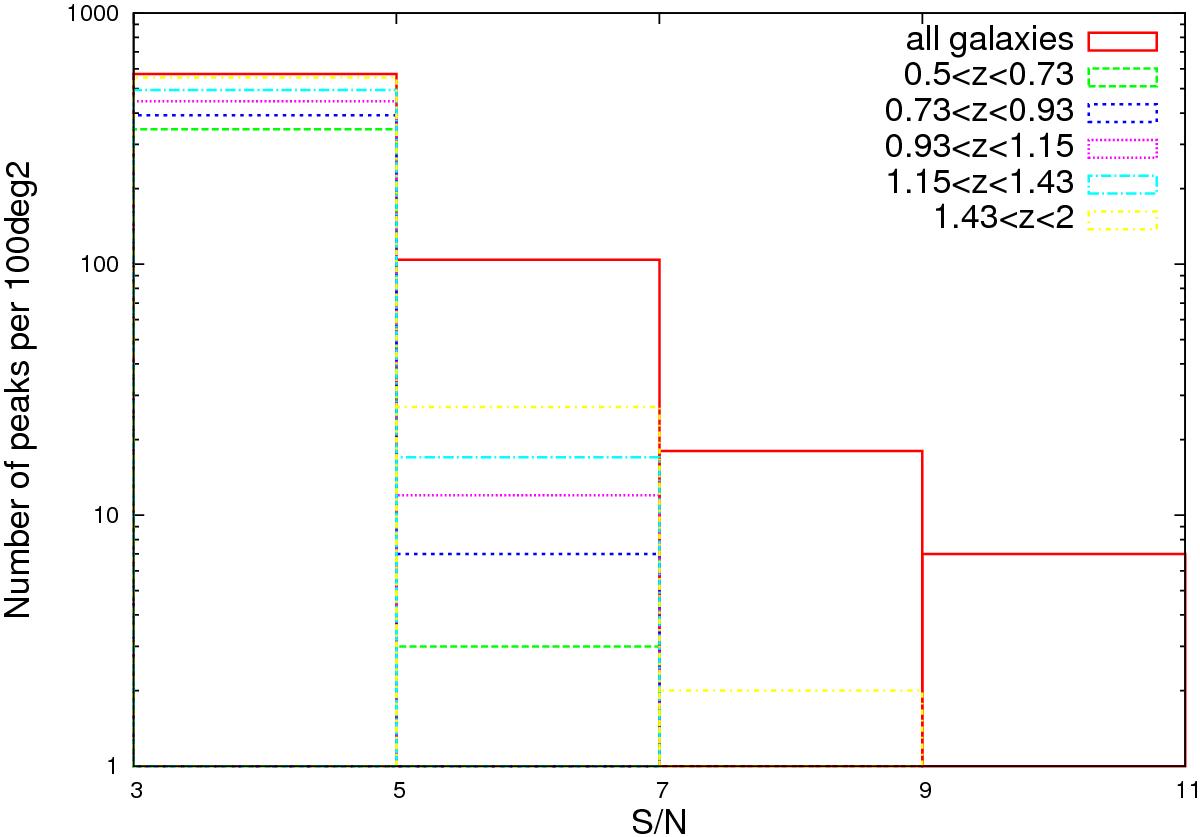
Mean number of peaks over the 150 realizations of the fiducial cosmology. The red histogram corresponds to peaks detected in the 2D analysis while green, blue, pink, cyan, and yellow, respectively, correspond to peaks detected in the 0.5 <z ≤ 0.73, 0.73 <z ≤ 0.93, 0.93 <z ≤ 1.15, 1.15 <z ≤ 1.43, and 1.43 <z ≤ 2 redshift slices.
Current usage metrics show cumulative count of Article Views (full-text article views including HTML views, PDF and ePub downloads, according to the available data) and Abstracts Views on Vision4Press platform.
Data correspond to usage on the plateform after 2015. The current usage metrics is available 48-96 hours after online publication and is updated daily on week days.
Initial download of the metrics may take a while.