Fig. 5
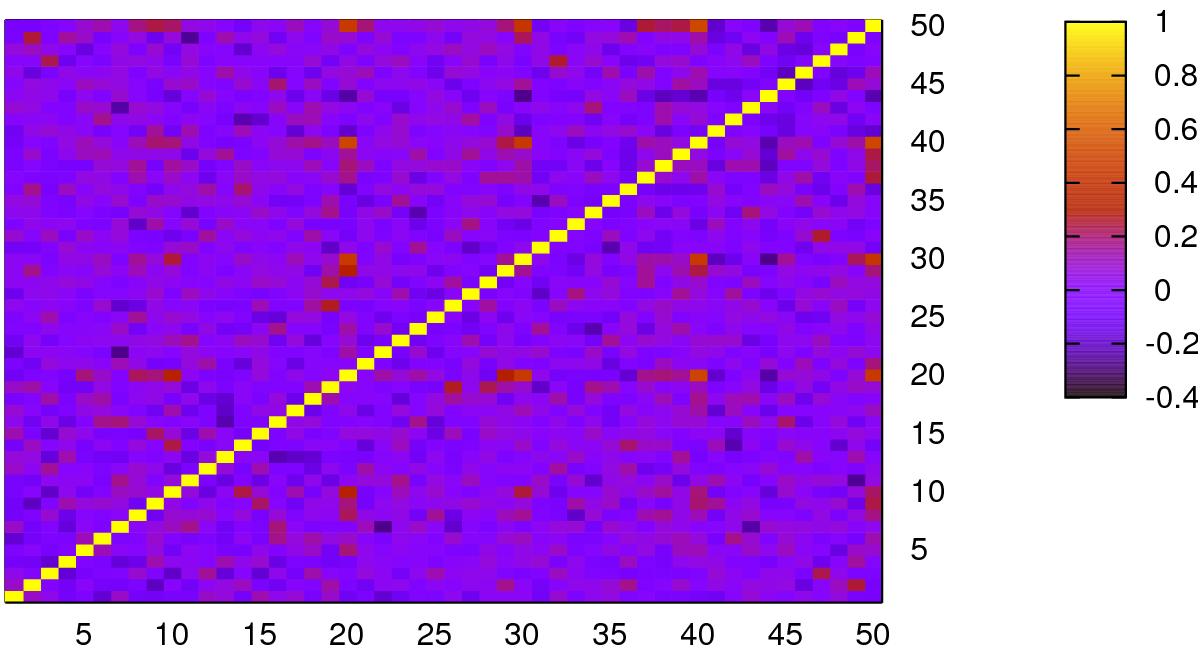
Correlation matrix of the shear peak distribution for a 100 square-degree field with tomography, calculated by averaging over 150 realizations of the fiducial cosmology (see Eq. (15)). Each redshift slice is divided into ten bins of peak height. This is the covariance matrix normalized to unit diagonal. Correlations between bins are less than 20%, except at the highest signal-to-noise.
Current usage metrics show cumulative count of Article Views (full-text article views including HTML views, PDF and ePub downloads, according to the available data) and Abstracts Views on Vision4Press platform.
Data correspond to usage on the plateform after 2015. The current usage metrics is available 48-96 hours after online publication and is updated daily on week days.
Initial download of the metrics may take a while.