Fig. 11
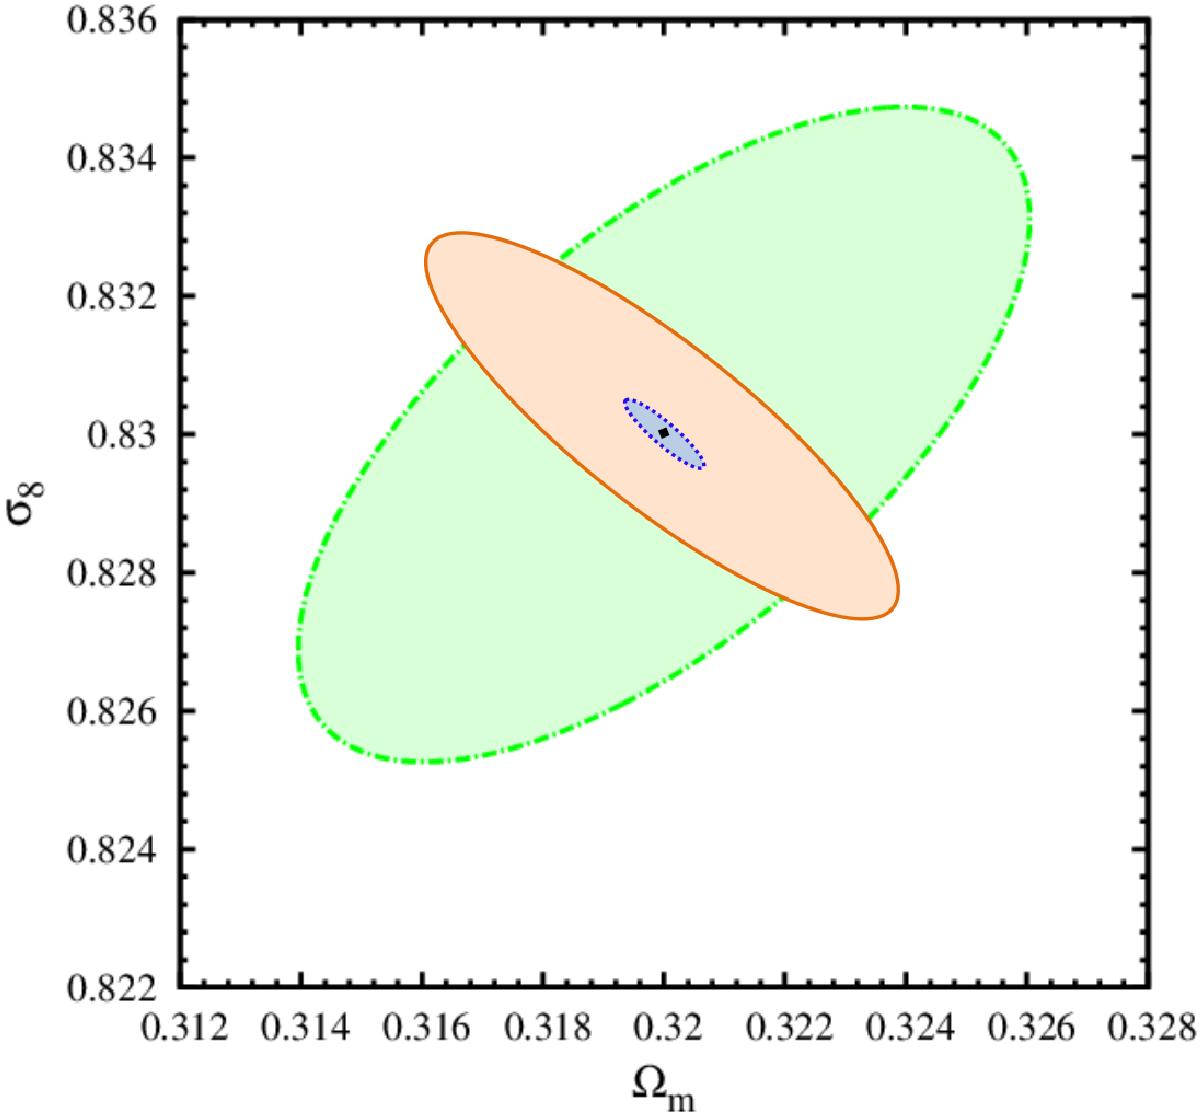
Comparison of predicted constraints from Euclid clusters and peak counts for a Euclid-like survey (1σ confidence limits). The orange ellipse traces the tomographic peak-count results. The blue dotted ellipse reports the constraints obtained from cluster number counts with a 3σ selection function assuming a perfectly known observable-mass relation (see Sartoris et al. 2015). The green dash-dotted ellipse shows the same cluster constraints but leaving the 4 scaling relation parameters (bias, scatter, and their evolution) completely free to vary. We note the change of scale and shift of fiducial parameter values from Fig. 10.
Current usage metrics show cumulative count of Article Views (full-text article views including HTML views, PDF and ePub downloads, according to the available data) and Abstracts Views on Vision4Press platform.
Data correspond to usage on the plateform after 2015. The current usage metrics is available 48-96 hours after online publication and is updated daily on week days.
Initial download of the metrics may take a while.