Fig. 10
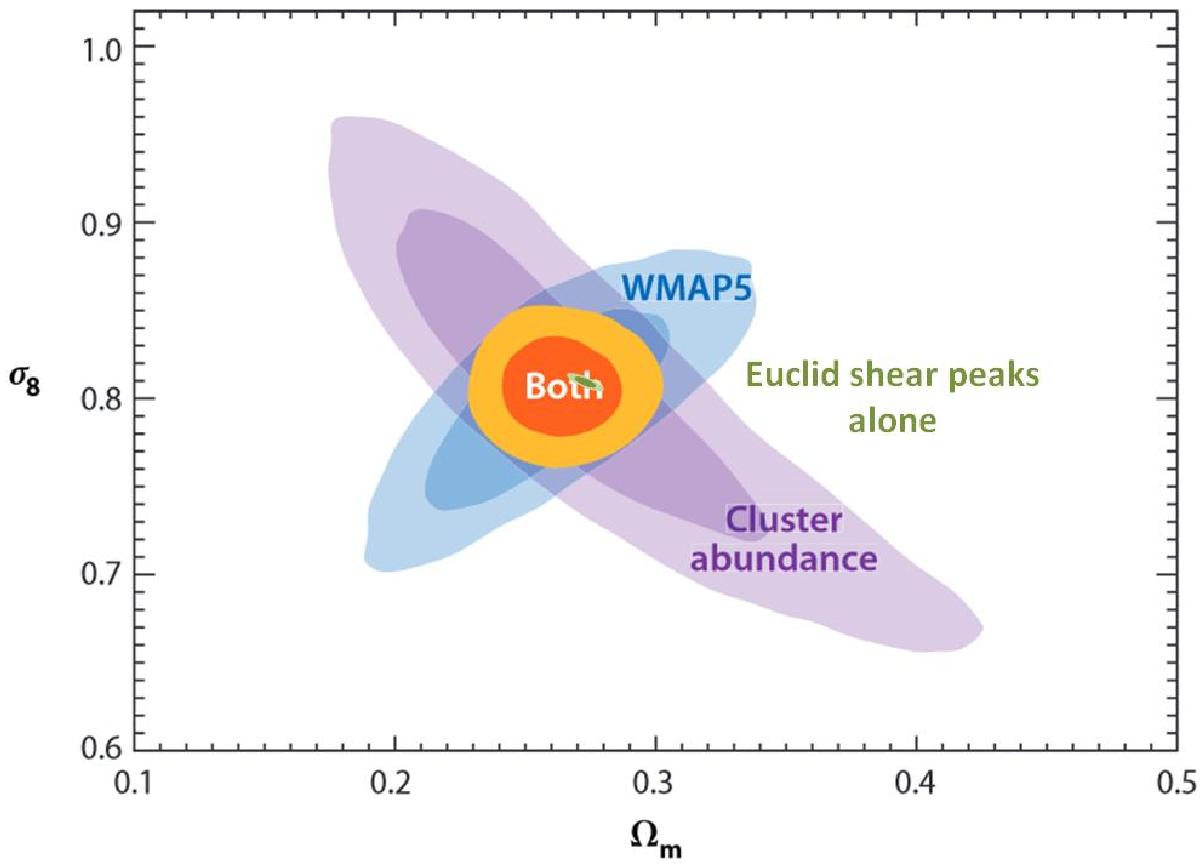
Constraints from tomographic peak counts compared to current galaxy cluster constraints, with contours giving the 1 and 2σ confidence limits. The violet shading represents constraints from the maxBCG cluster catalog, blue those from WMAP-5, and the yellow their combination; they have been adapted from Allen et al. (2011). The green contours give the tomographic peak-count constraints for a Euclid-like survey covering 15 000 square degrees.
Current usage metrics show cumulative count of Article Views (full-text article views including HTML views, PDF and ePub downloads, according to the available data) and Abstracts Views on Vision4Press platform.
Data correspond to usage on the plateform after 2015. The current usage metrics is available 48-96 hours after online publication and is updated daily on week days.
Initial download of the metrics may take a while.