Fig. 9
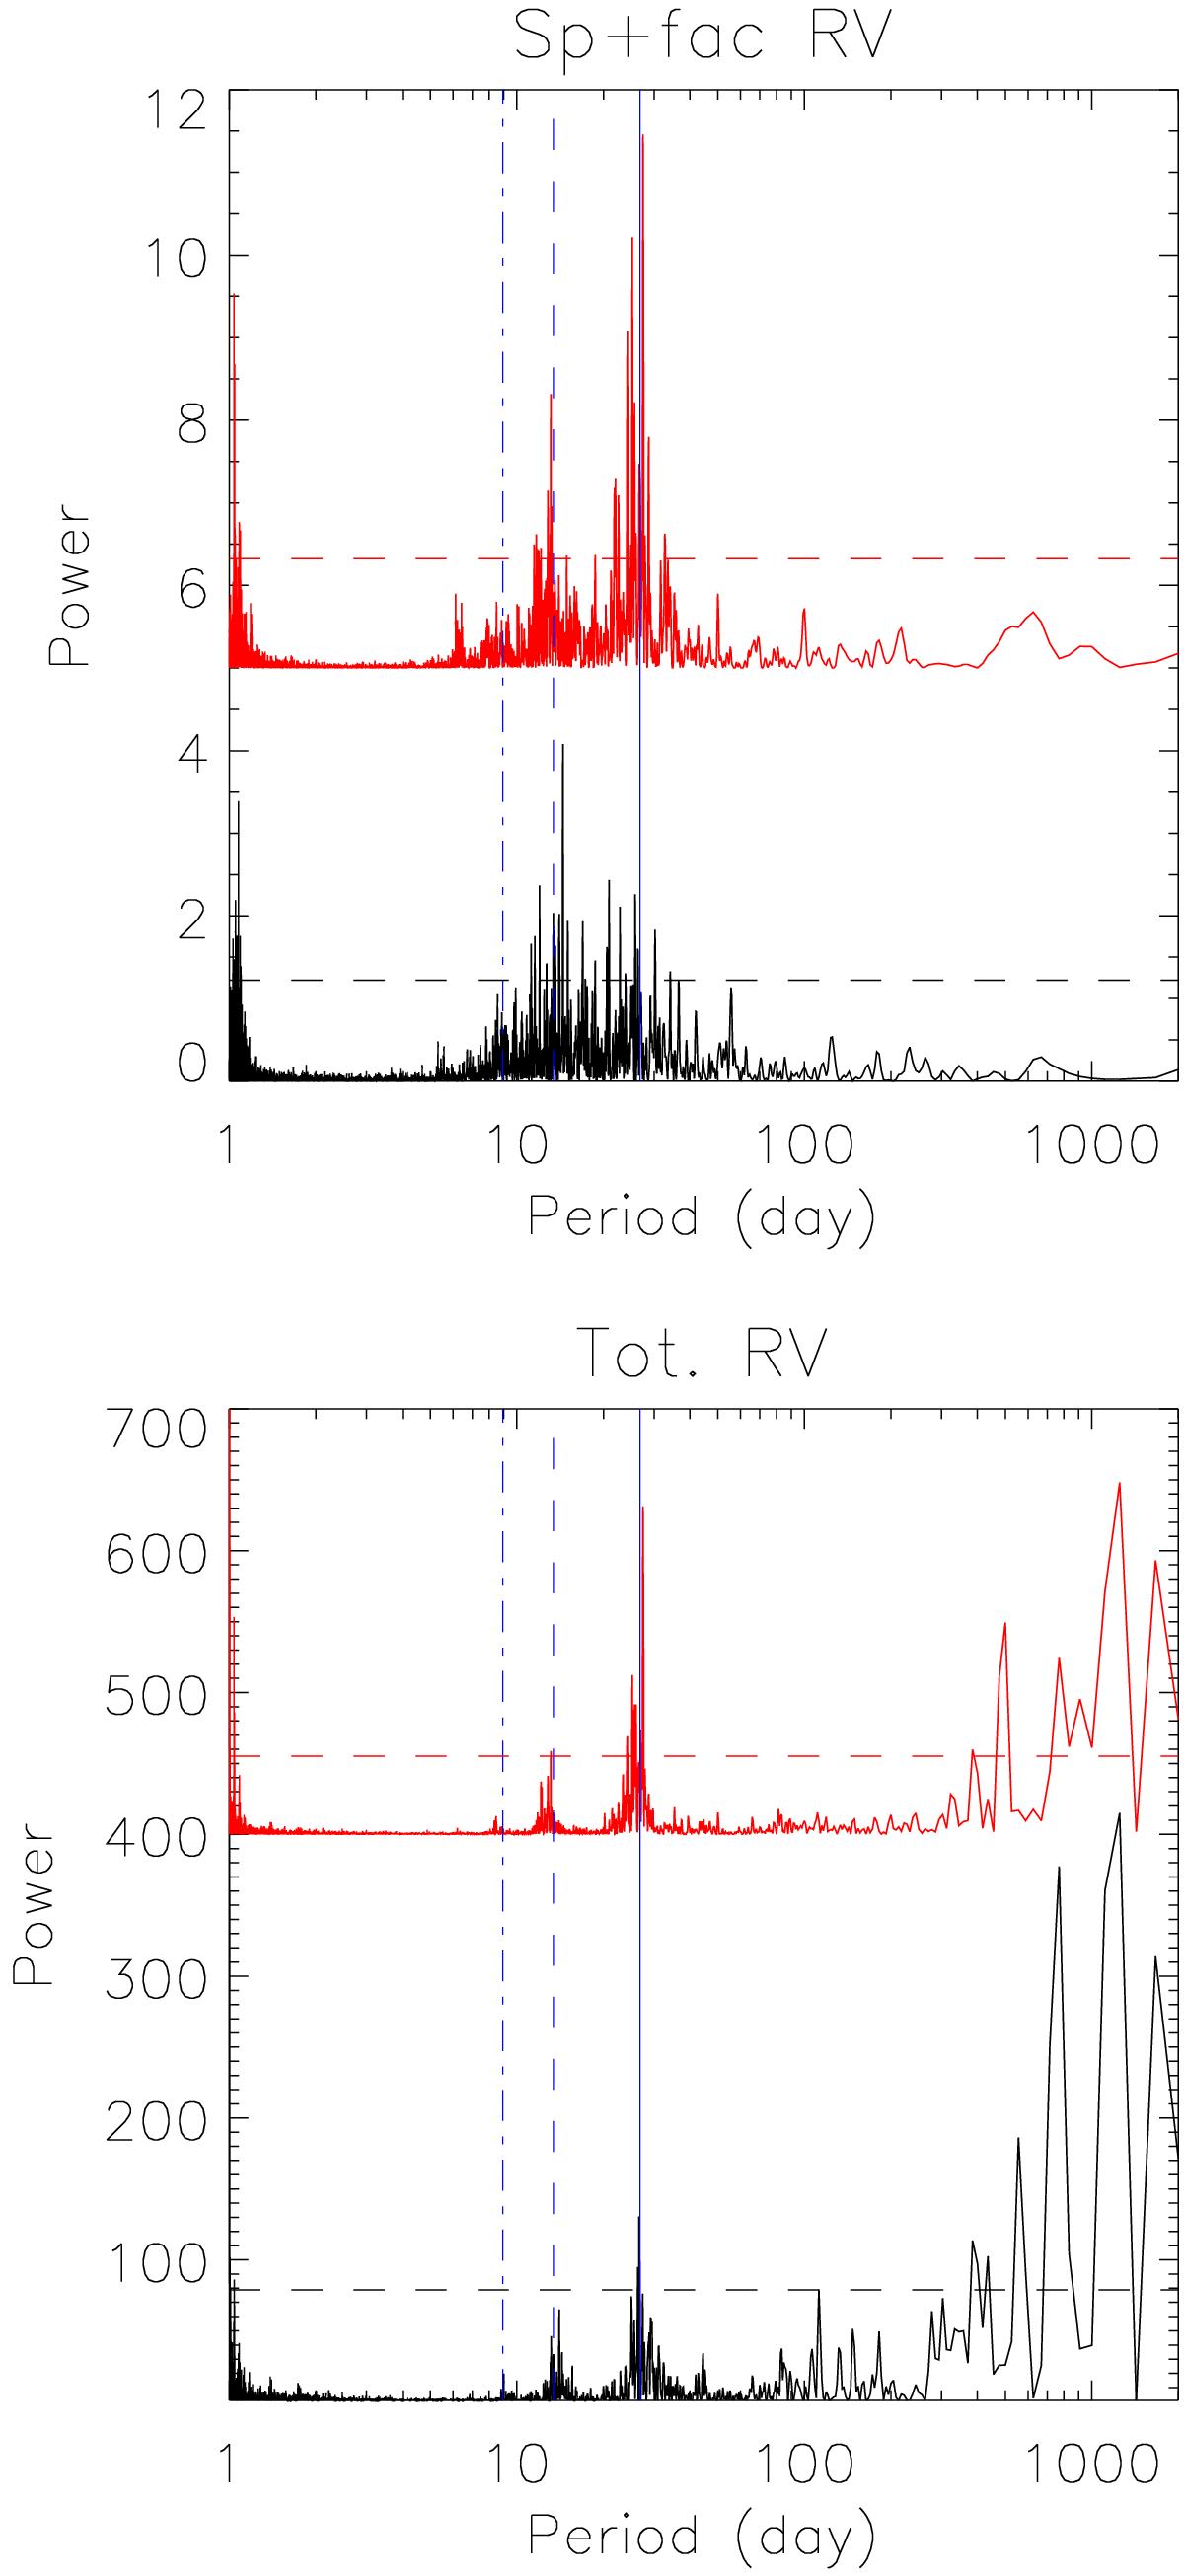
Lomb-Scargle periodograms of the RV time series based respectively on the observed (black solid line) and simulated (red solid line) activity patterns, alongside the 1% false-alarm probabilities (FAP, dashed lines). Top: spot+facula contribution. Bottom: sum of all contributions. We note that in both panels the periodograms corresponding to the simulations are vertically shifted for visibility. The solar rotation period and its two first harmonics are shwon in blue (solid, dashed and dash-dotted blue lines).
Current usage metrics show cumulative count of Article Views (full-text article views including HTML views, PDF and ePub downloads, according to the available data) and Abstracts Views on Vision4Press platform.
Data correspond to usage on the plateform after 2015. The current usage metrics is available 48-96 hours after online publication and is updated daily on week days.
Initial download of the metrics may take a while.