Fig. 15
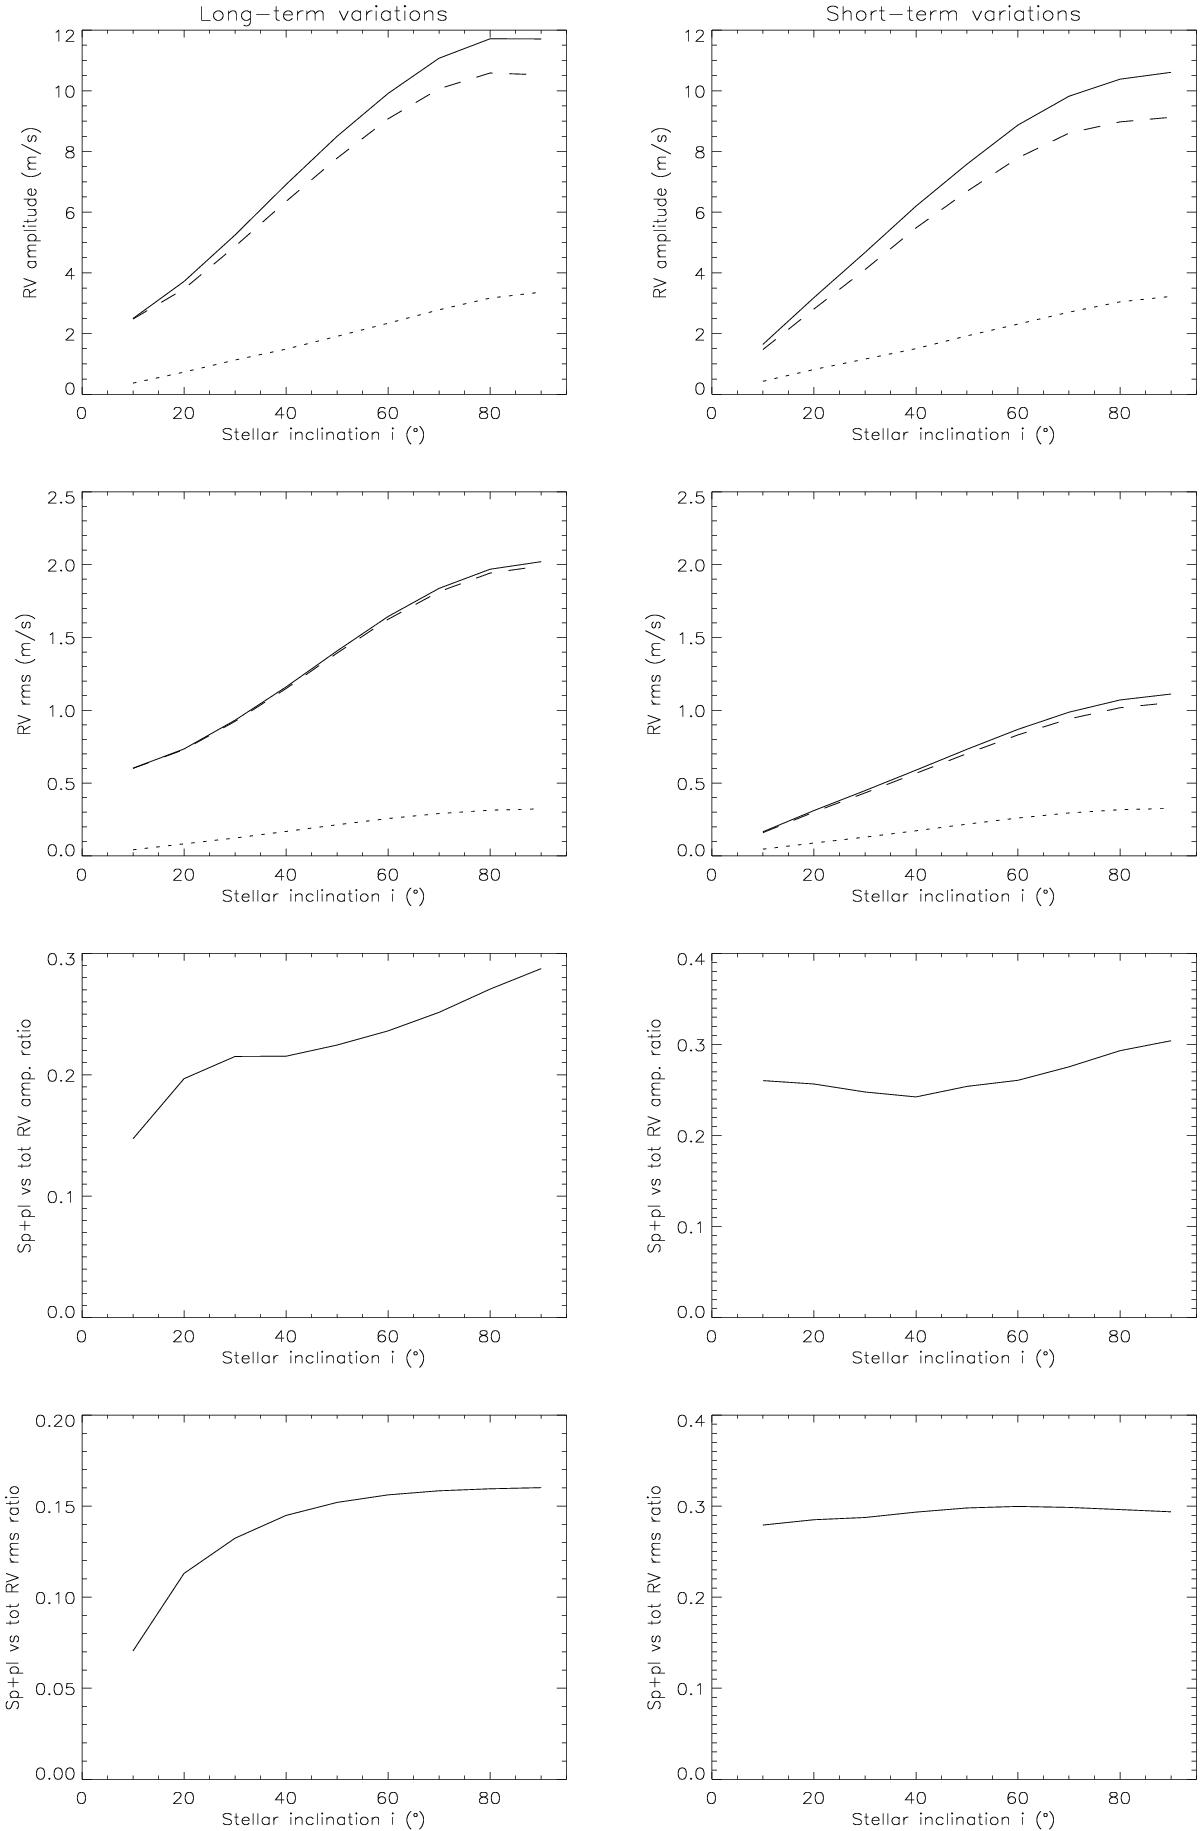
Characterization of the RV signal versus sin(i). Left: long-term variations of the signal (RV time series as produced by our simulations). Right: short-term variations of the RV signal (residuals of the original RV data minus the 30-day averaged RV). From top to bottom: peak-to-peak amplitude of the RV signal, RV dispersion (rms), ratio of the amplitudes of the spot+facula RV to the total RV, and ratio of the rms of these two signals as a function of sin(i). On the two top panels, the spot+facula (dotted line), convective (dashed line) and total RV (solid line) are also displayed as a function of sin(i).
Current usage metrics show cumulative count of Article Views (full-text article views including HTML views, PDF and ePub downloads, according to the available data) and Abstracts Views on Vision4Press platform.
Data correspond to usage on the plateform after 2015. The current usage metrics is available 48-96 hours after online publication and is updated daily on week days.
Initial download of the metrics may take a while.