Fig. 12
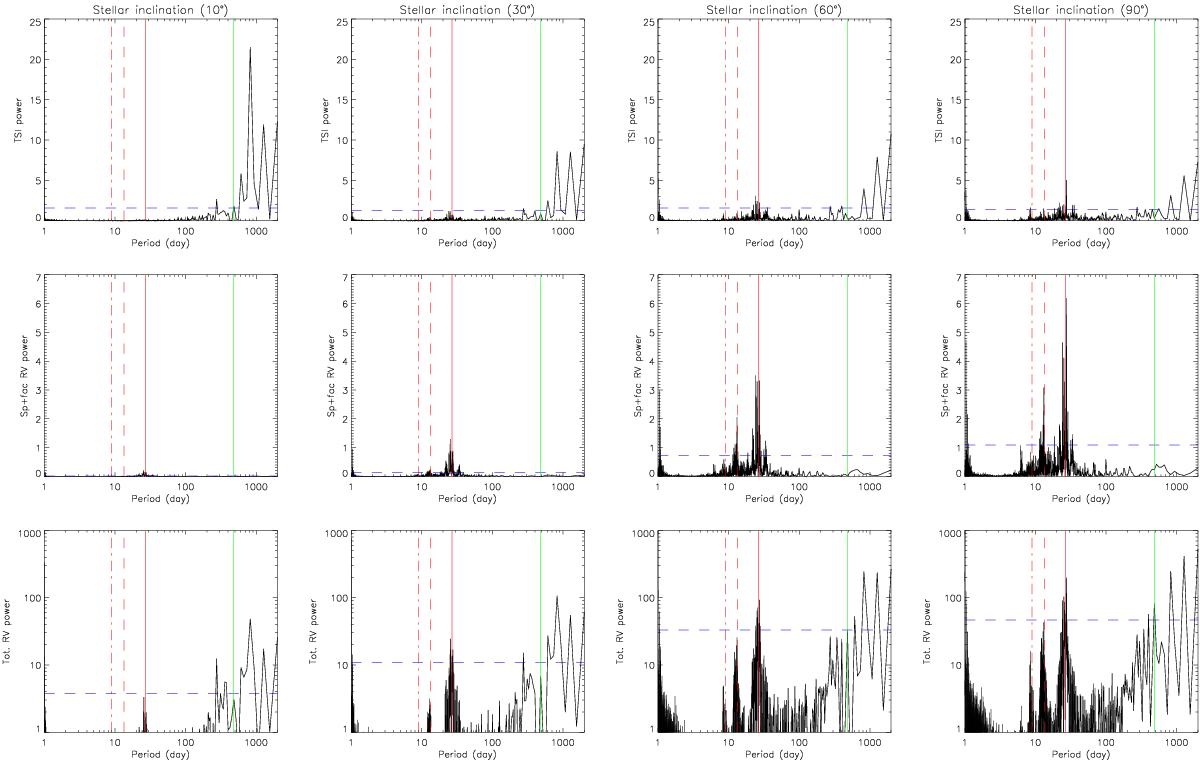
Top: periodogram of the TSI for significant inclinations (from left to right: i = 10°, 30°, 60° and 90°). The 1% false-alarm probabilities (FAP) are displayed (blue dashed line), as well as the equatorial stellar rotation period and its two first harmonics (red solid, dashed, and dotted-dashed lines, respectively), and the 480-day period for the computing of the detection limits (green solid line). Middle: the same for the RV “photometric” component (spot+facula). Bottom: the same for the total RV.
Current usage metrics show cumulative count of Article Views (full-text article views including HTML views, PDF and ePub downloads, according to the available data) and Abstracts Views on Vision4Press platform.
Data correspond to usage on the plateform after 2015. The current usage metrics is available 48-96 hours after online publication and is updated daily on week days.
Initial download of the metrics may take a while.