Fig. 3
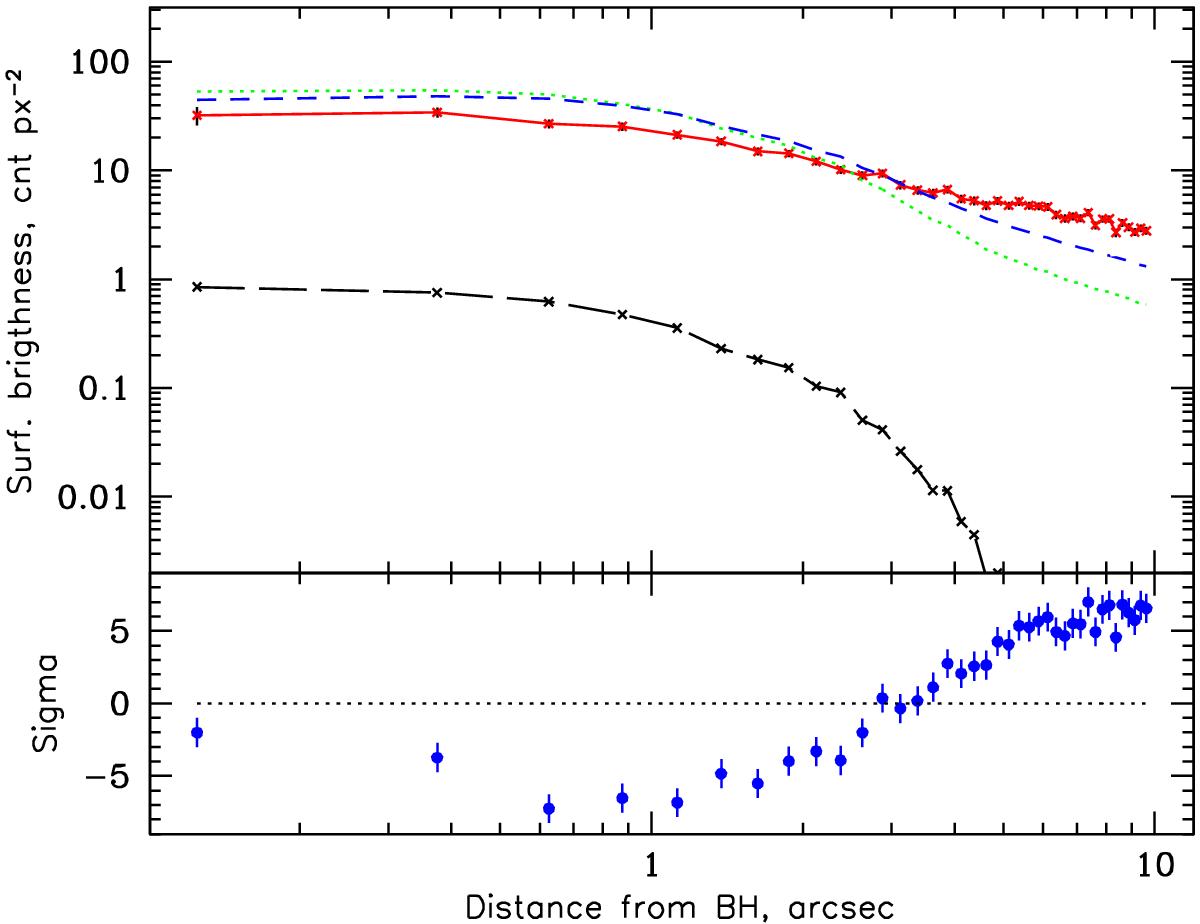
Vicinity of the black hole up to 10′′ from Sgr A*. Red points with errors represent the observed profile, and are connected by continuous line. The black long-dashed line is the normalized PSF. Two models convolved with PSF are also presented: green dotted line for ![]() keV, and blue short-dashed line for
keV, and blue short-dashed line for ![]() keV. Residuals are shown for the best fitted model in the range up to 10′′, i.e. for
keV. Residuals are shown for the best fitted model in the range up to 10′′, i.e. for ![]() keV.
keV.
Current usage metrics show cumulative count of Article Views (full-text article views including HTML views, PDF and ePub downloads, according to the available data) and Abstracts Views on Vision4Press platform.
Data correspond to usage on the plateform after 2015. The current usage metrics is available 48-96 hours after online publication and is updated daily on week days.
Initial download of the metrics may take a while.