Fig. 1
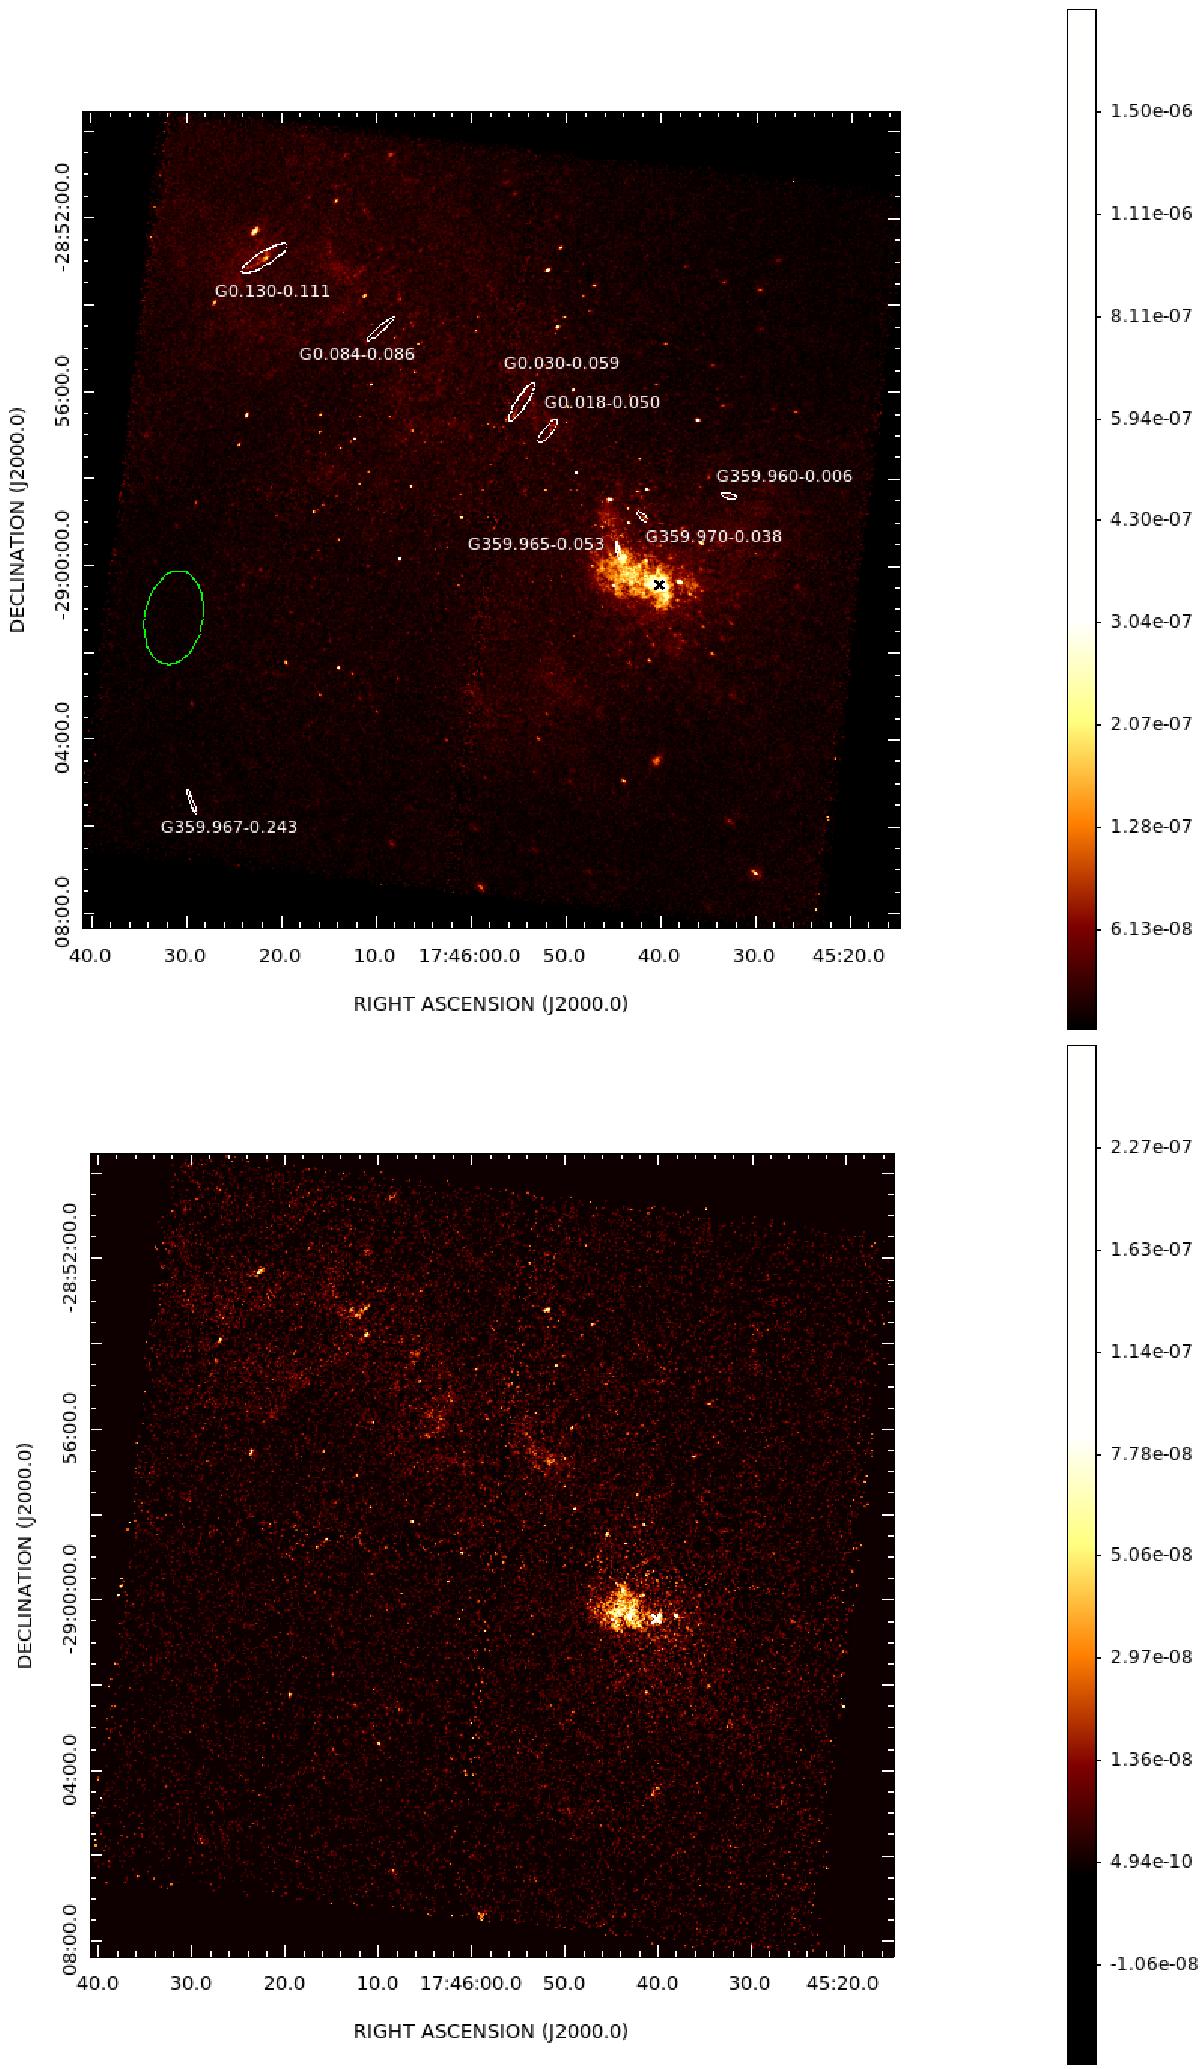
Flux image of the GC in the 0.5−8 keV energy range (upper panel). Sgr A* is marked with a black cross. A few brightest filaments reported by Johnson et al. (2009) are marked with small white ellipses and labelled following the names given in the previous detection. The large green ellipse shows the region used for background spectrum extraction (distant background, see Sect. 2.4 for details). The bottom panel shows the flux image of the GC in the energy range of 6.3−7.0 keV, where the iron line is created. The emission presented here is the Kα line emission after subtracting the continuum flux. The flux is presented in asinh scale, since it behaves well for negative count rate values that might originate during the subtraction process.
Current usage metrics show cumulative count of Article Views (full-text article views including HTML views, PDF and ePub downloads, according to the available data) and Abstracts Views on Vision4Press platform.
Data correspond to usage on the plateform after 2015. The current usage metrics is available 48-96 hours after online publication and is updated daily on week days.
Initial download of the metrics may take a while.