Fig. 4
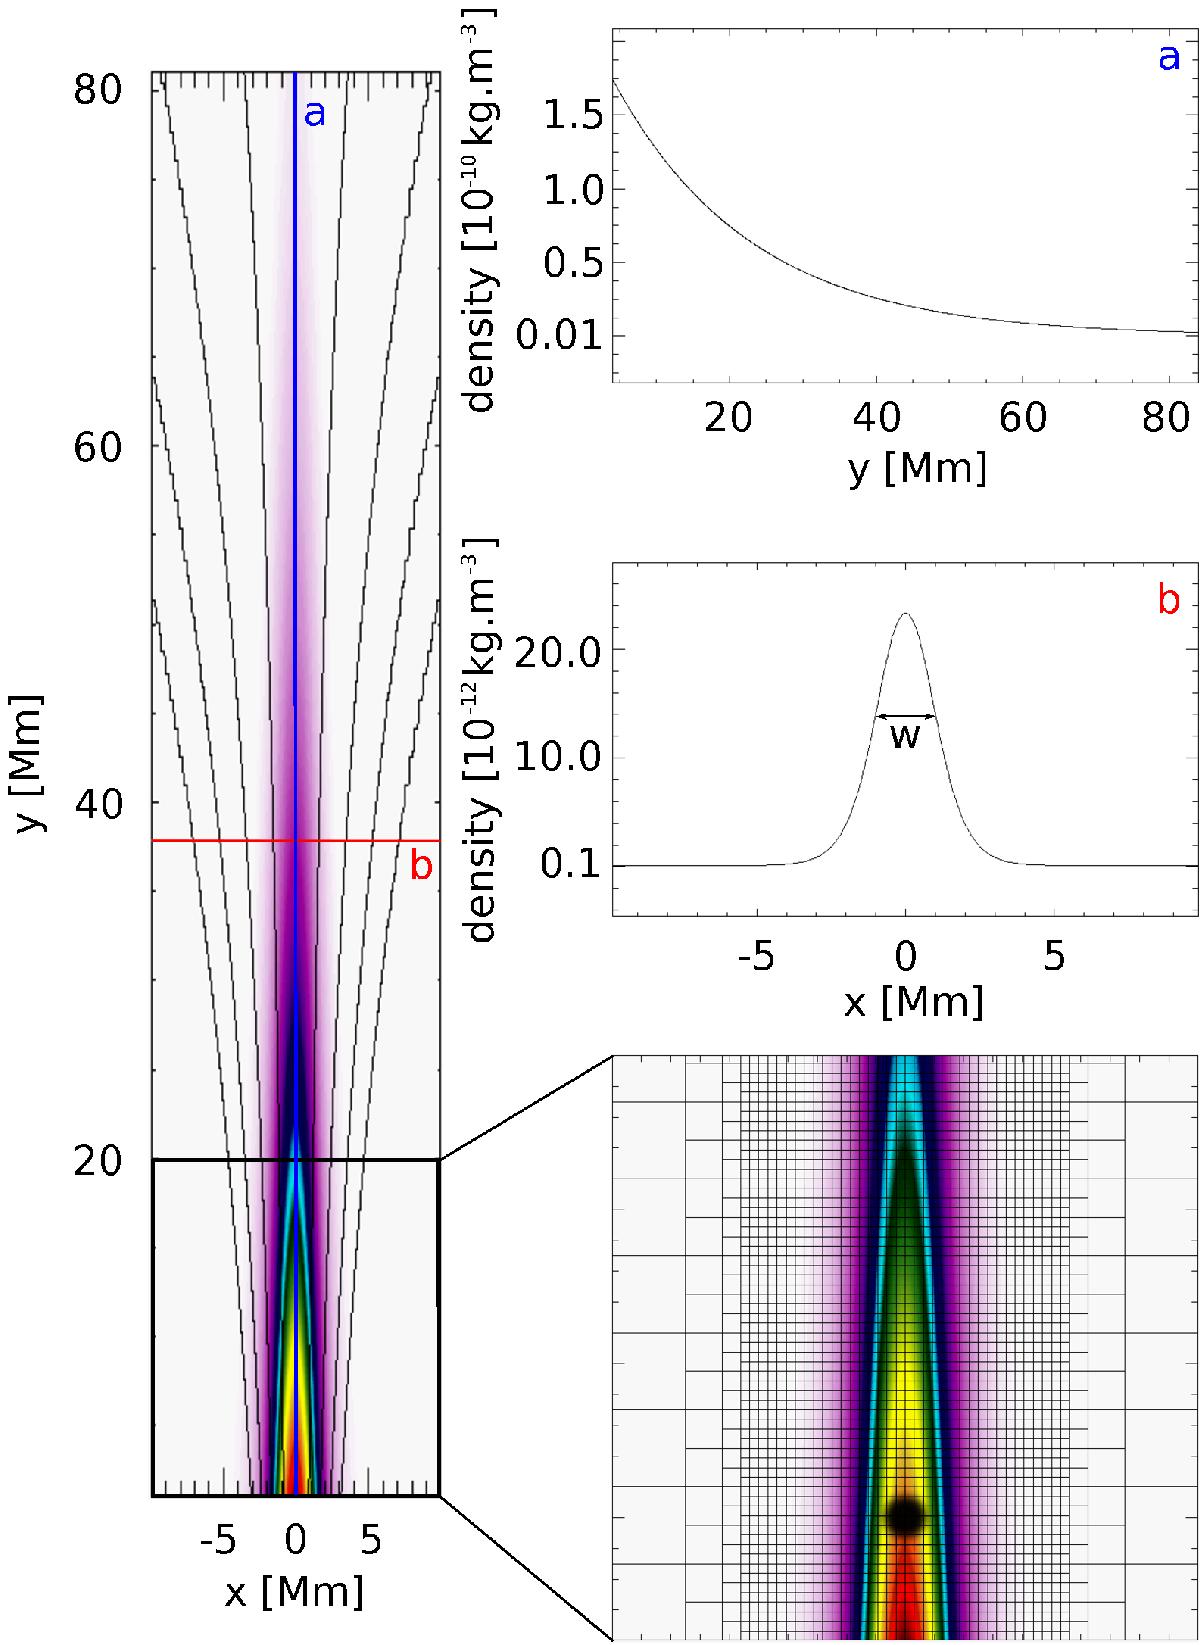
Mass density distribution in the Harris current sheet, where the black contours represent the structure of magnetic field. On the right-hand side of the figure both a) vertical (for x = 0 Mm) and b) horizontal (for y = 37.65 Mm, which is magnetic scale height) slices in mass density are shown, as well as the details of the part of the simulation region illustrating the computational grid, with adaptive mesh refinement (AMR). At the altitude y = 5 Mm the perturbation point, LP, is marked by full black circle.
Current usage metrics show cumulative count of Article Views (full-text article views including HTML views, PDF and ePub downloads, according to the available data) and Abstracts Views on Vision4Press platform.
Data correspond to usage on the plateform after 2015. The current usage metrics is available 48-96 hours after online publication and is updated daily on week days.
Initial download of the metrics may take a while.