Fig. 4
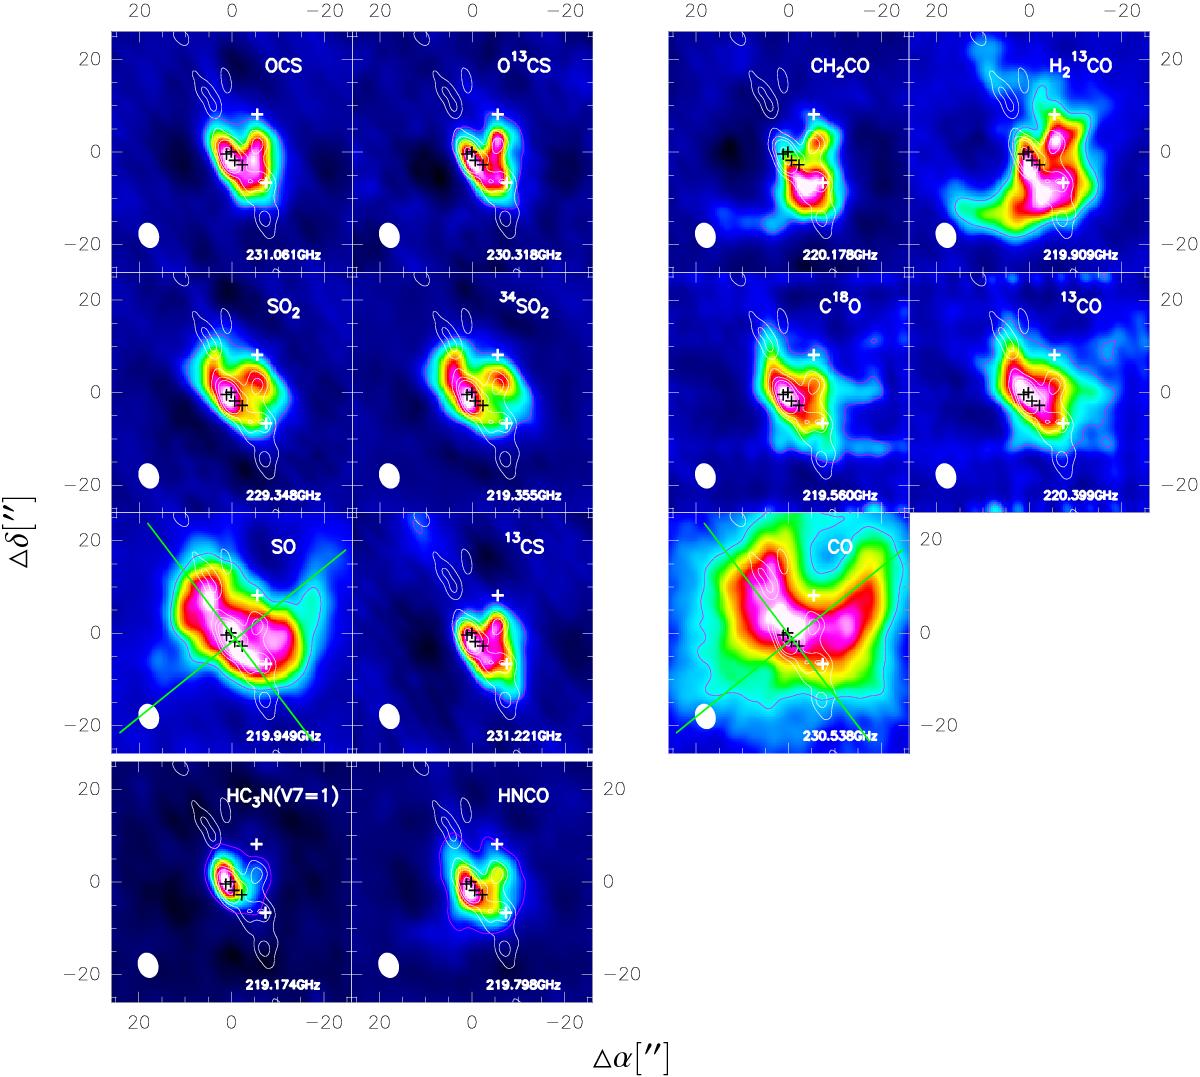
Intensity distribution maps of transitions from molecules containing <6 atoms, which are detected in the combined SMA-30 m data at 1.3 mm (corresponding quantum numbers are listed in Table A.1, with “†” marks). The intensities have been derived by integrating the line emission over the velocity range shown in Fig. A.3. The filled beam in the bottom left corner is from SMA-30 m data. White contours show the continuum from the SMA-only data (at −5σ, 5σ, 15σ, 25σ, and 60σ levels). Purple contours show ± 1σ levels of the molecular emission (solid contours indicate positive flux, and dashed contours indicate negative flux). Green lines in the SO and CO maps sketch the outflow directions. The white crosses denote the BN object and the CR, and the black crosses denote the positions of the hotcore, Source I, Source N, and SMA1, as in Fig. 2. All images have different colour scales (in Jy beam-1 km s-1), increasing from black to white, which are optimized to emphasize the features in the distribution of each molecules.
Current usage metrics show cumulative count of Article Views (full-text article views including HTML views, PDF and ePub downloads, according to the available data) and Abstracts Views on Vision4Press platform.
Data correspond to usage on the plateform after 2015. The current usage metrics is available 48-96 hours after online publication and is updated daily on week days.
Initial download of the metrics may take a while.