Fig. A.4
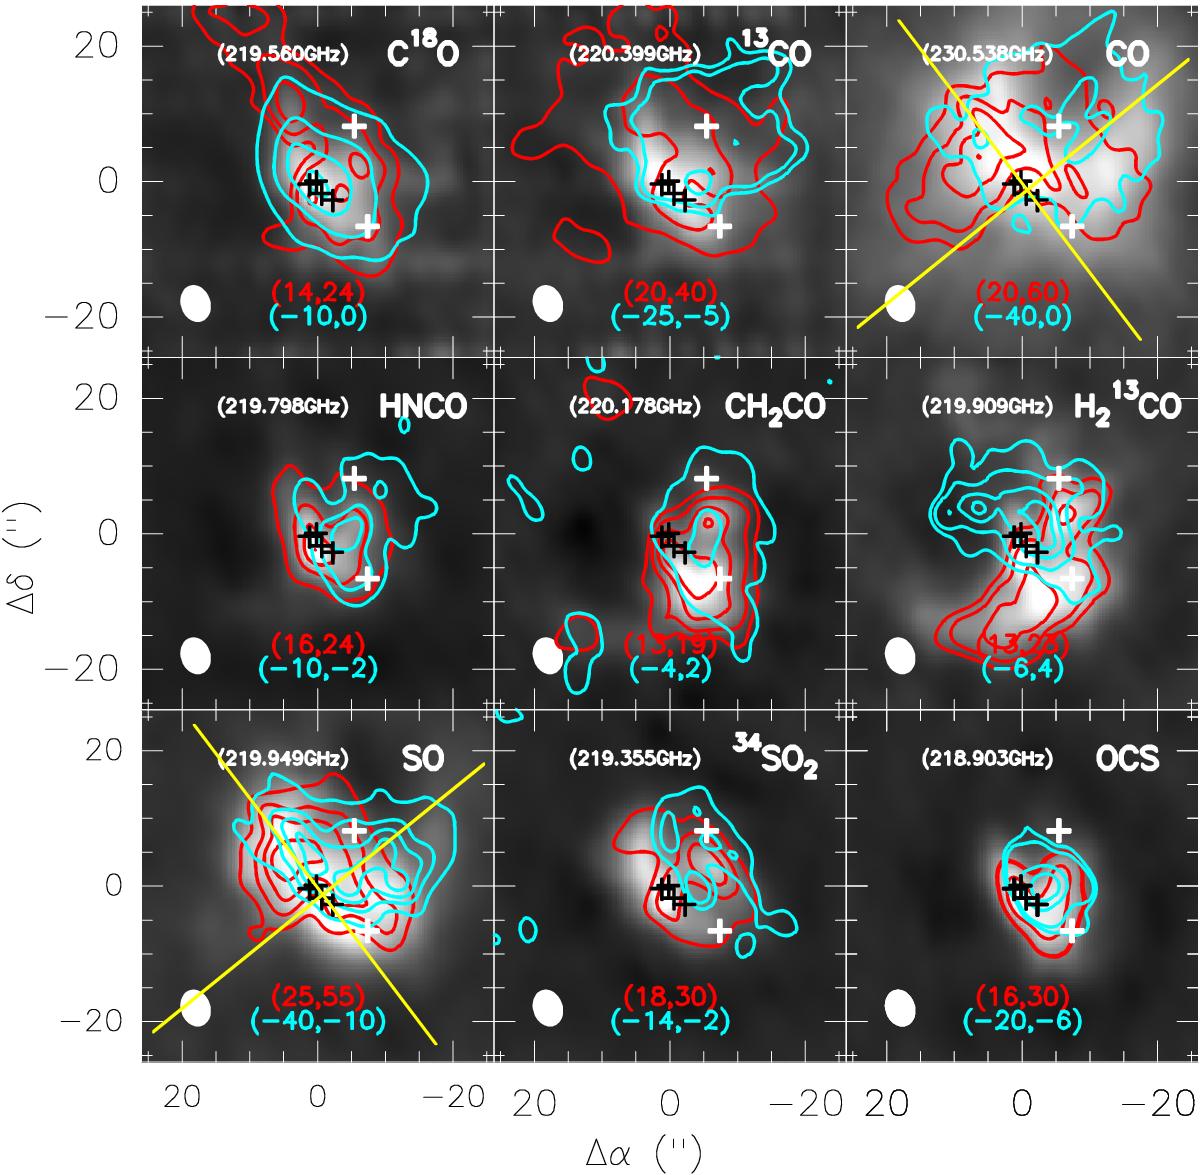
Line wing flux integration maps from the combined SMA-30 m data at 1.3 mm. The grey maps show the intensity integrated ranging through the main emission of their linewidth in Fig. A.3. Red and blue contours show the red-shifted and blue-shifted gas, with the intensity integrated as labelled. Yellow lines sketch the outflow directions. Black crosses denote the hotcore, SMA1, Source I, and Source N; white crosses denote the BN object and CR.
Current usage metrics show cumulative count of Article Views (full-text article views including HTML views, PDF and ePub downloads, according to the available data) and Abstracts Views on Vision4Press platform.
Data correspond to usage on the plateform after 2015. The current usage metrics is available 48-96 hours after online publication and is updated daily on week days.
Initial download of the metrics may take a while.